1.1.1 Launching Stand-alone From the Keyark Home Page
1.1.2 Launching from KeySQL Studio
1.3 Changing the Model Display
1.3.2 Coloration and Centering
1.4.2 Graphics File Type and Name
1.5 Design or Redesign the Data Model
1.5.3 Locating All Occurrences
1.6 KeySQL Statements for Generating the Model
Help is available from four sources:
The User guide is accessed from the ? (help) button at the far right:

The online version of the User guide can be searched by clicking CTRL+F (Windows) or Command+F (Mac).
The KeySQL Data Modeling Tool is a state-of-the-art web application for modeling complex, non-flat data. It is useful for:
The Data Modeling Tool ( 'tool' ) can be run stand-alone but works in tandem with KeySQL Studio to deliver additional functionality. KeySQL Studio can be used to load your data into KeySQL Server, automatically generating a data catalog from a variety of data sources, both flat (e.g., SQL) and non-flat (e.g., MongoDB). With that catalog, the Data Modelling Tool can render the data model in your choice of layout. The data model is rendered as an image file that can be shared and/or printed out.
The user interface is simple and powerful, enabling database developers, data analysts and business users to share the same data model. Data models of any complexity can be created, making the tool useful for not only KeySQL but also any NoSQL database or application that handles non-flat data.
In terms of common terminology for SQL data modeling tools, this tool most closely resembles a ' logical' data modeling tool. It is far more than just a design time or documentation tool. It generates KeySQL statements that can create a KeySQL schema, ready for data loading, or which can alter an existing KeySQL schema.
The Data Modeling Tool can be run stand-alone or launched from KeySQL Studio.
FYI: A trial account for KeySQL Studio is available at no cost. You can register on the KEYARK.COM home page. Upon registration, you receive login credentials and the launch URL.
Credentials are unnecessary to launch the Data Modeling Tool. You can launch from this URL:
https://www.keyark.com/modeltool/
You should now jump to section 1.1.3 to begin your mastery of the Data Modeling Tool.
The Data Modeling Tool can be launched by clicking on a catalog in Explorer and selecting the Visualize menu option: 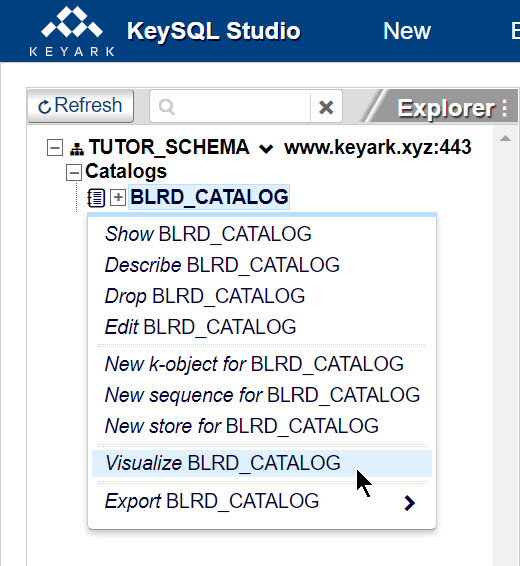
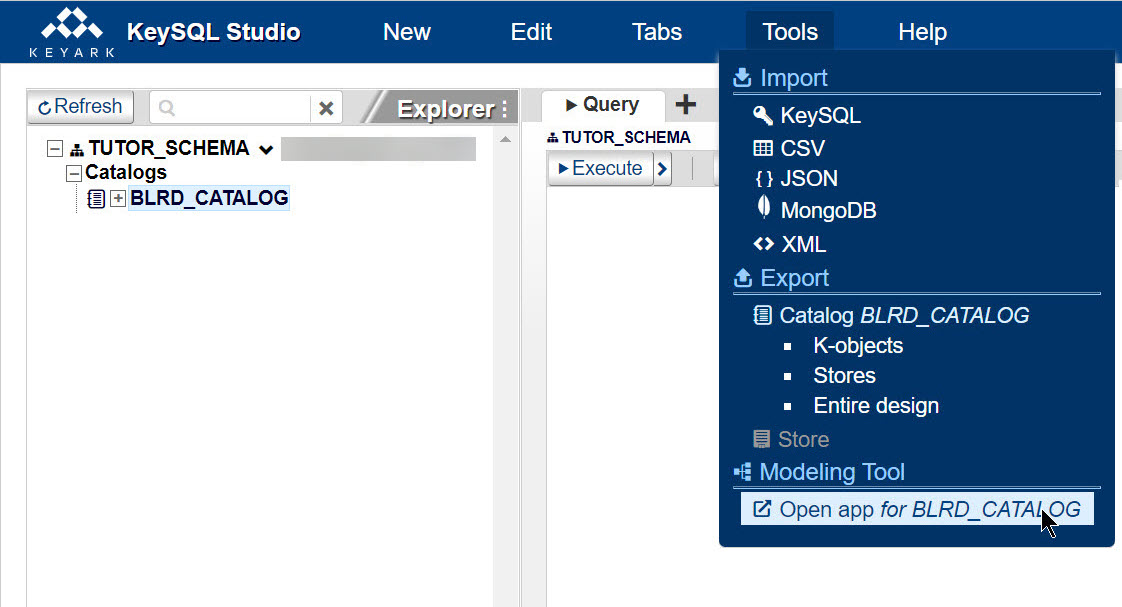
You can also launch from the Tools menu:
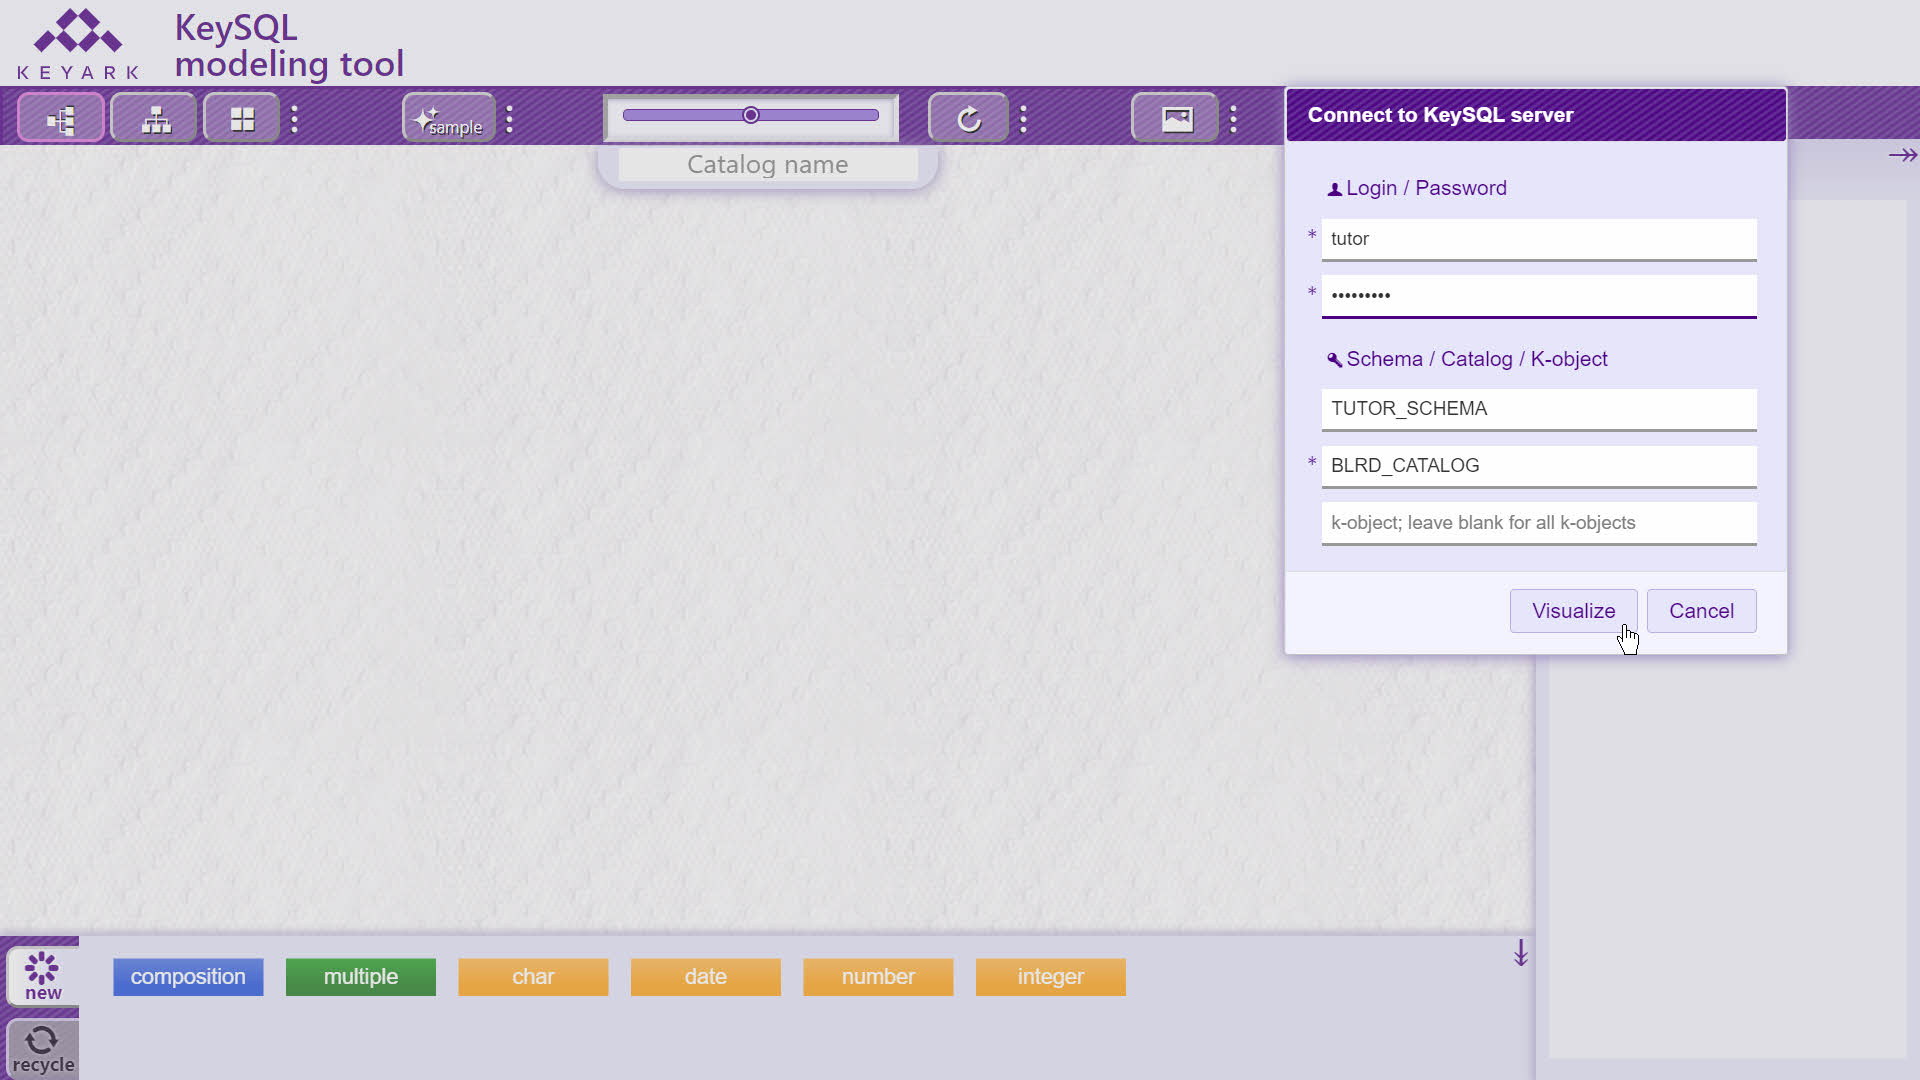
When the Data Modeling Tool is launched from KeySQL Studio it will assume you wish to start with an existing catalog on KeySQL Server, and automatically displays the Connect to KeySQL server connection dialogue:
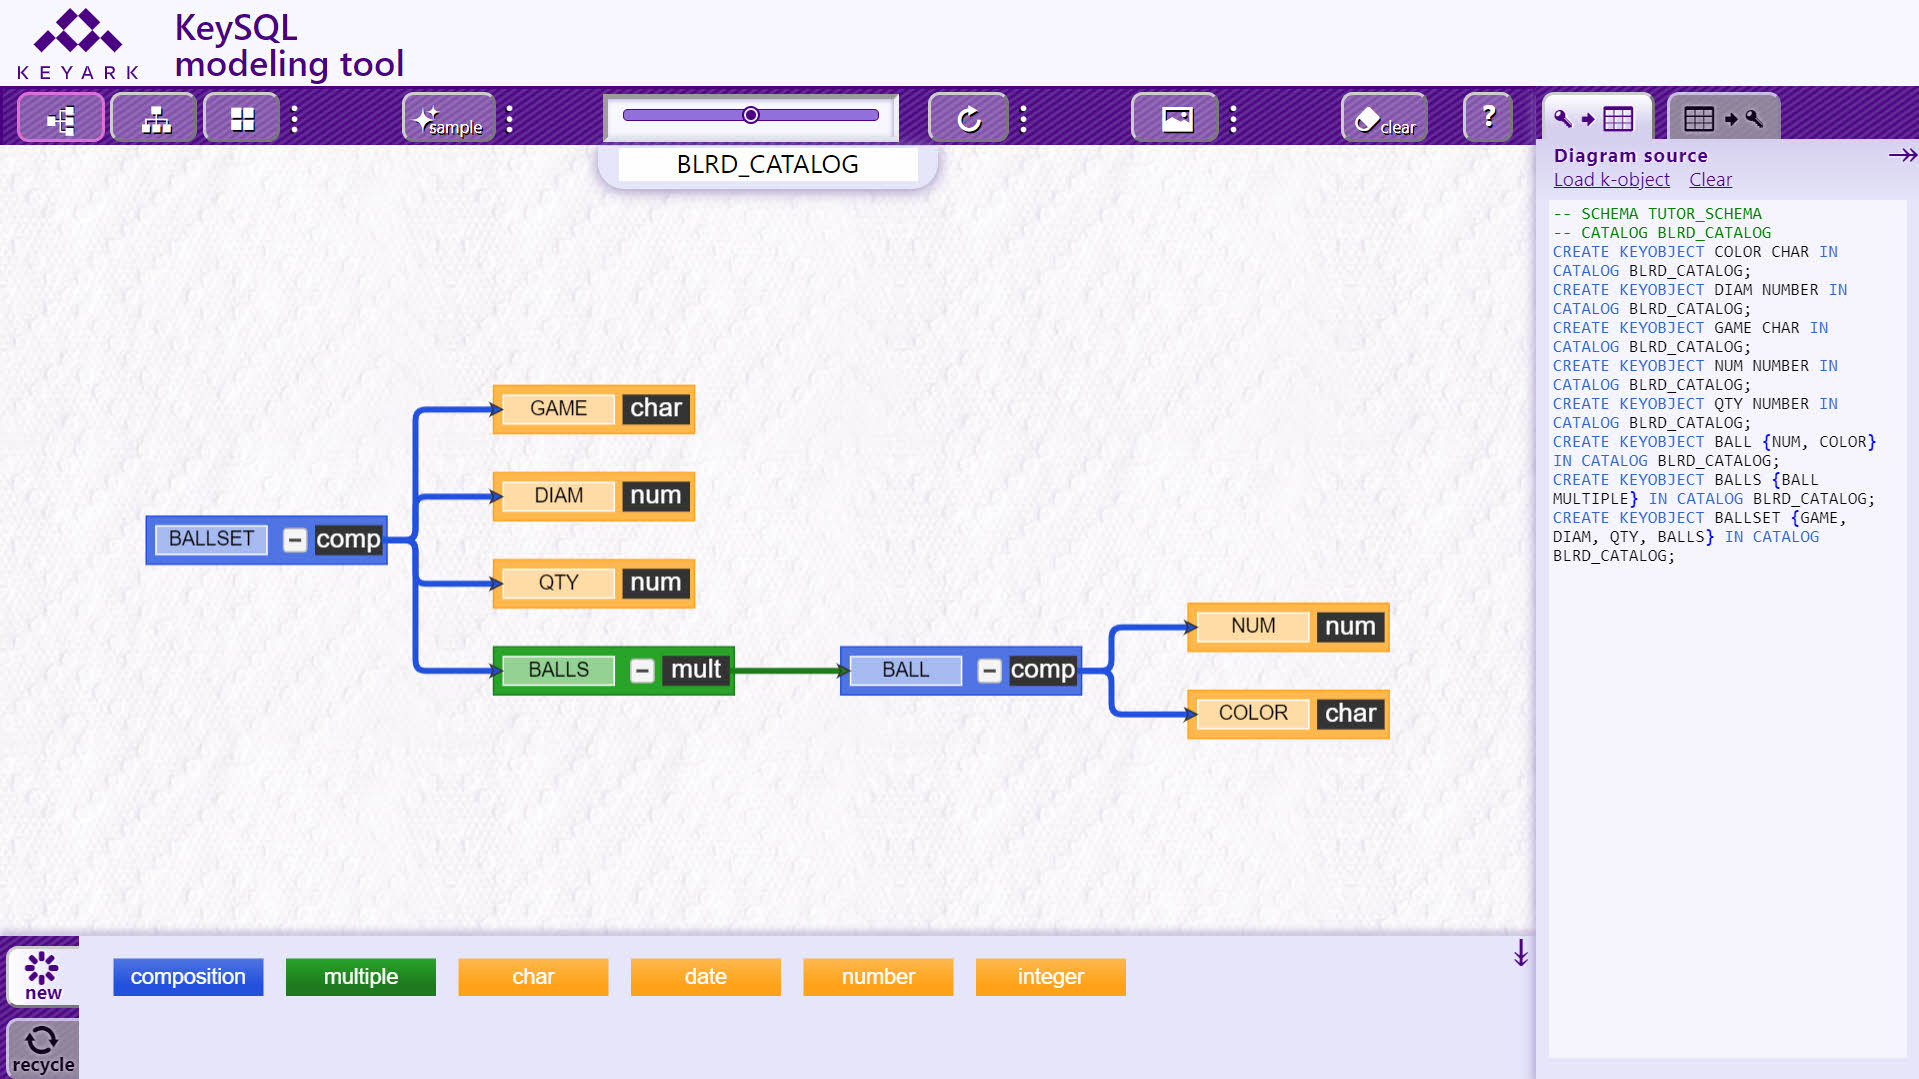
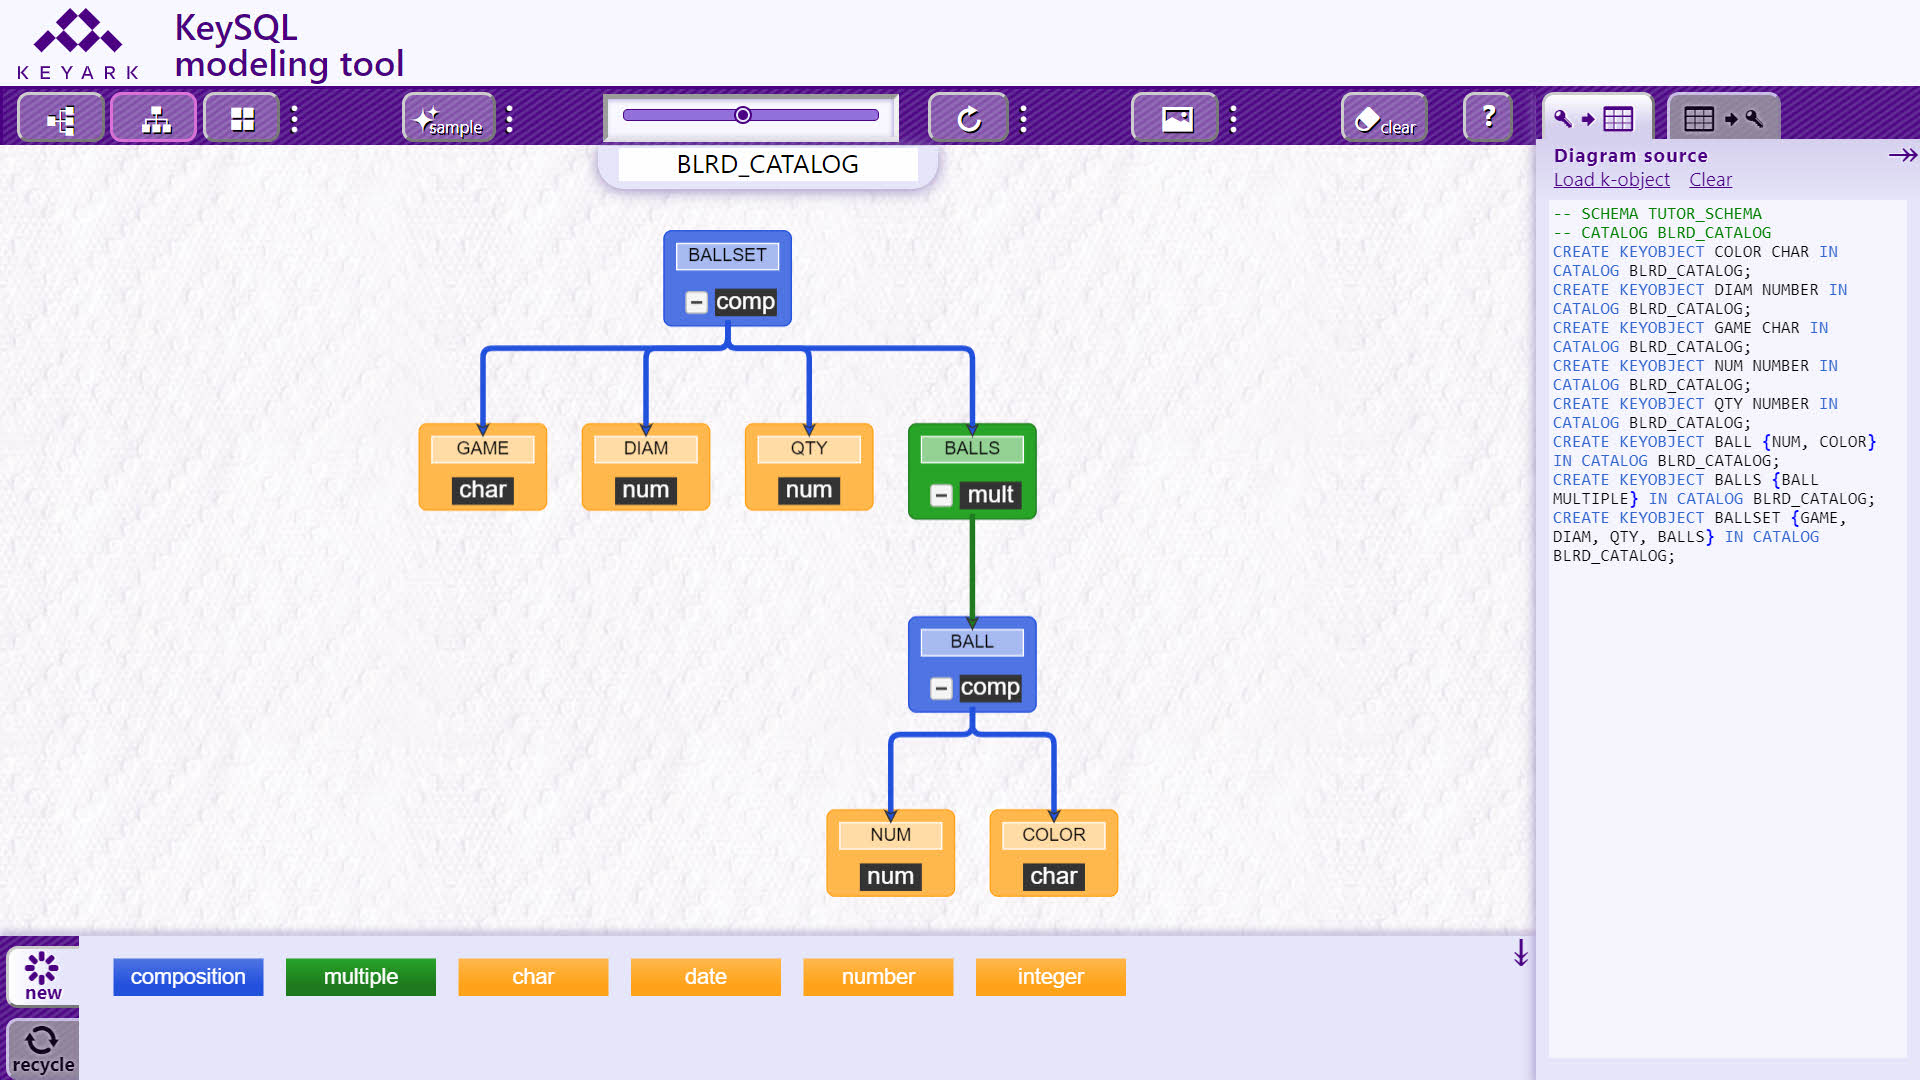
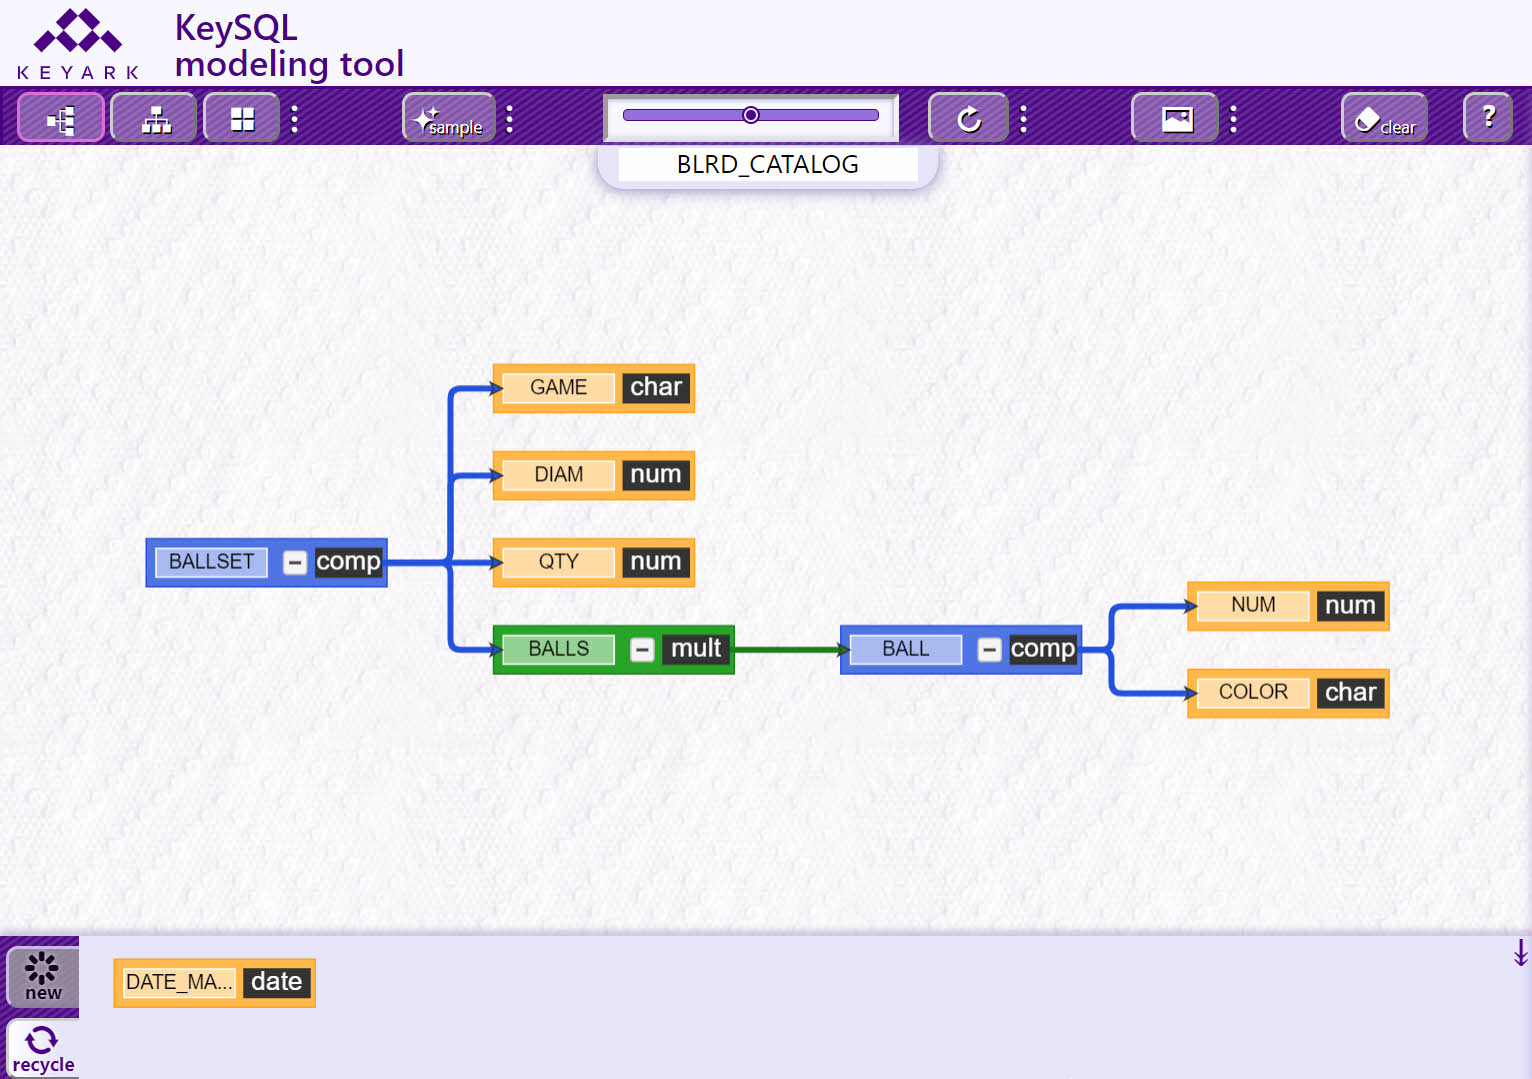
When you click the Visualize button the chosen catalog will be visualized in the default horizontal layout:
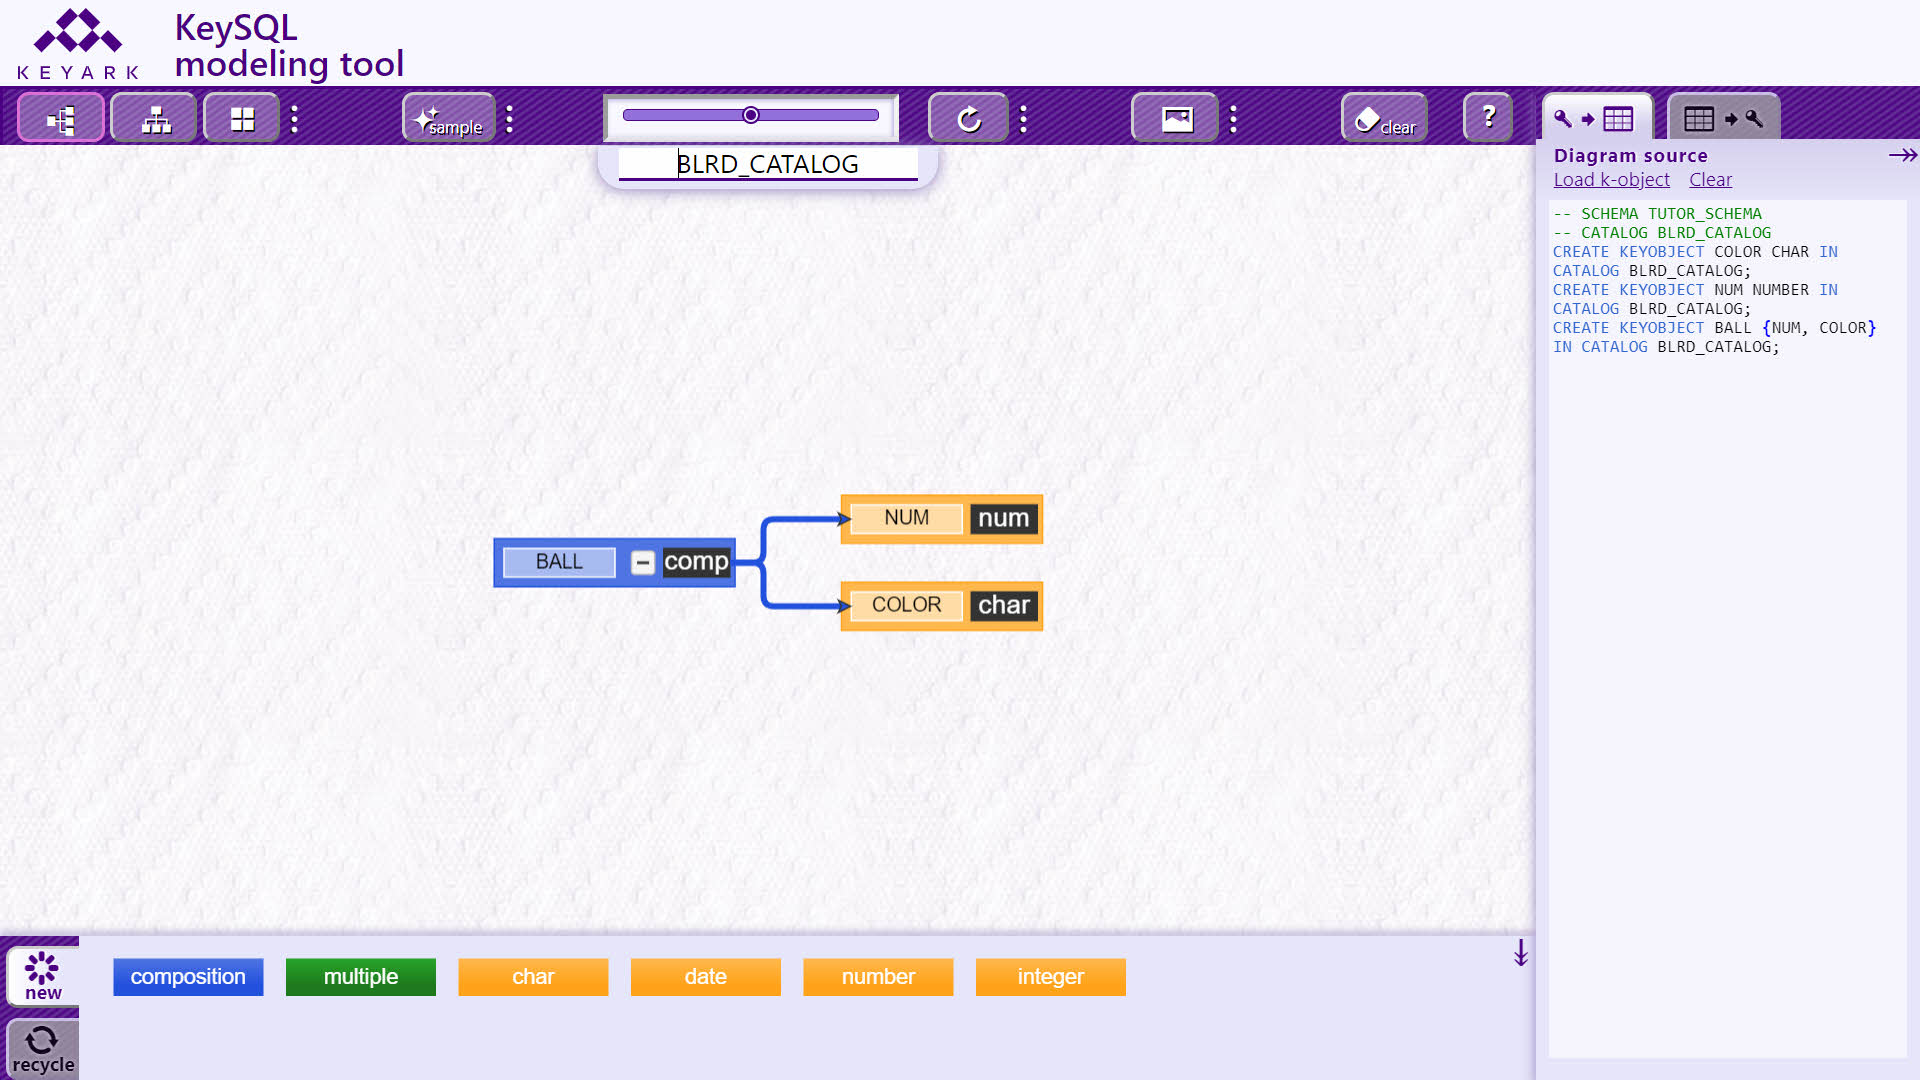
When you connect, you can also choose just part of the catalog, which is especially helpful for large catalogs. In this example the k-object BALL within the BLRD_CATALOG was selected, and only that part of the catalog is visualized:
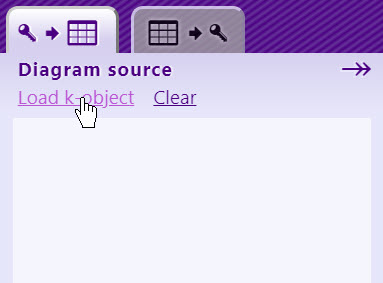
The next two screenshots will explain how the scope of the visualization was narrowed.
To change the source of the visualization, click Load k-object, which redisplays the connection form:
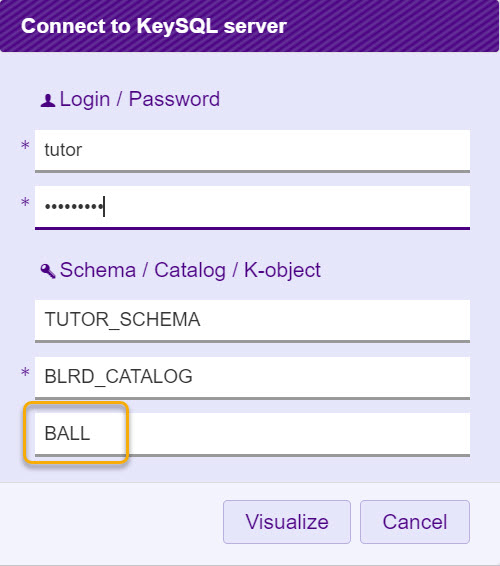
In the screenshot below, schema and catalog are unchanged, but the optional text field for specifying a k-object is used to narrow the visualization to just the BALL composite k-object:
A set of sample catalogs are provided, including the BLRD_CATALOG shown in this guide.
To load or reload a sample catalog, click the sample button:
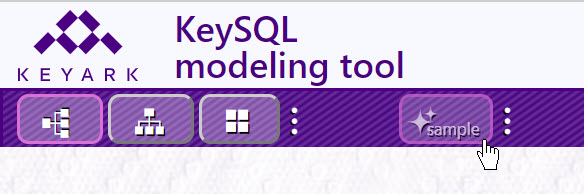
To choose among the samples, click the triple dot options button to the right of the sample button:

This guide so far has displayed a data model with these default settings:

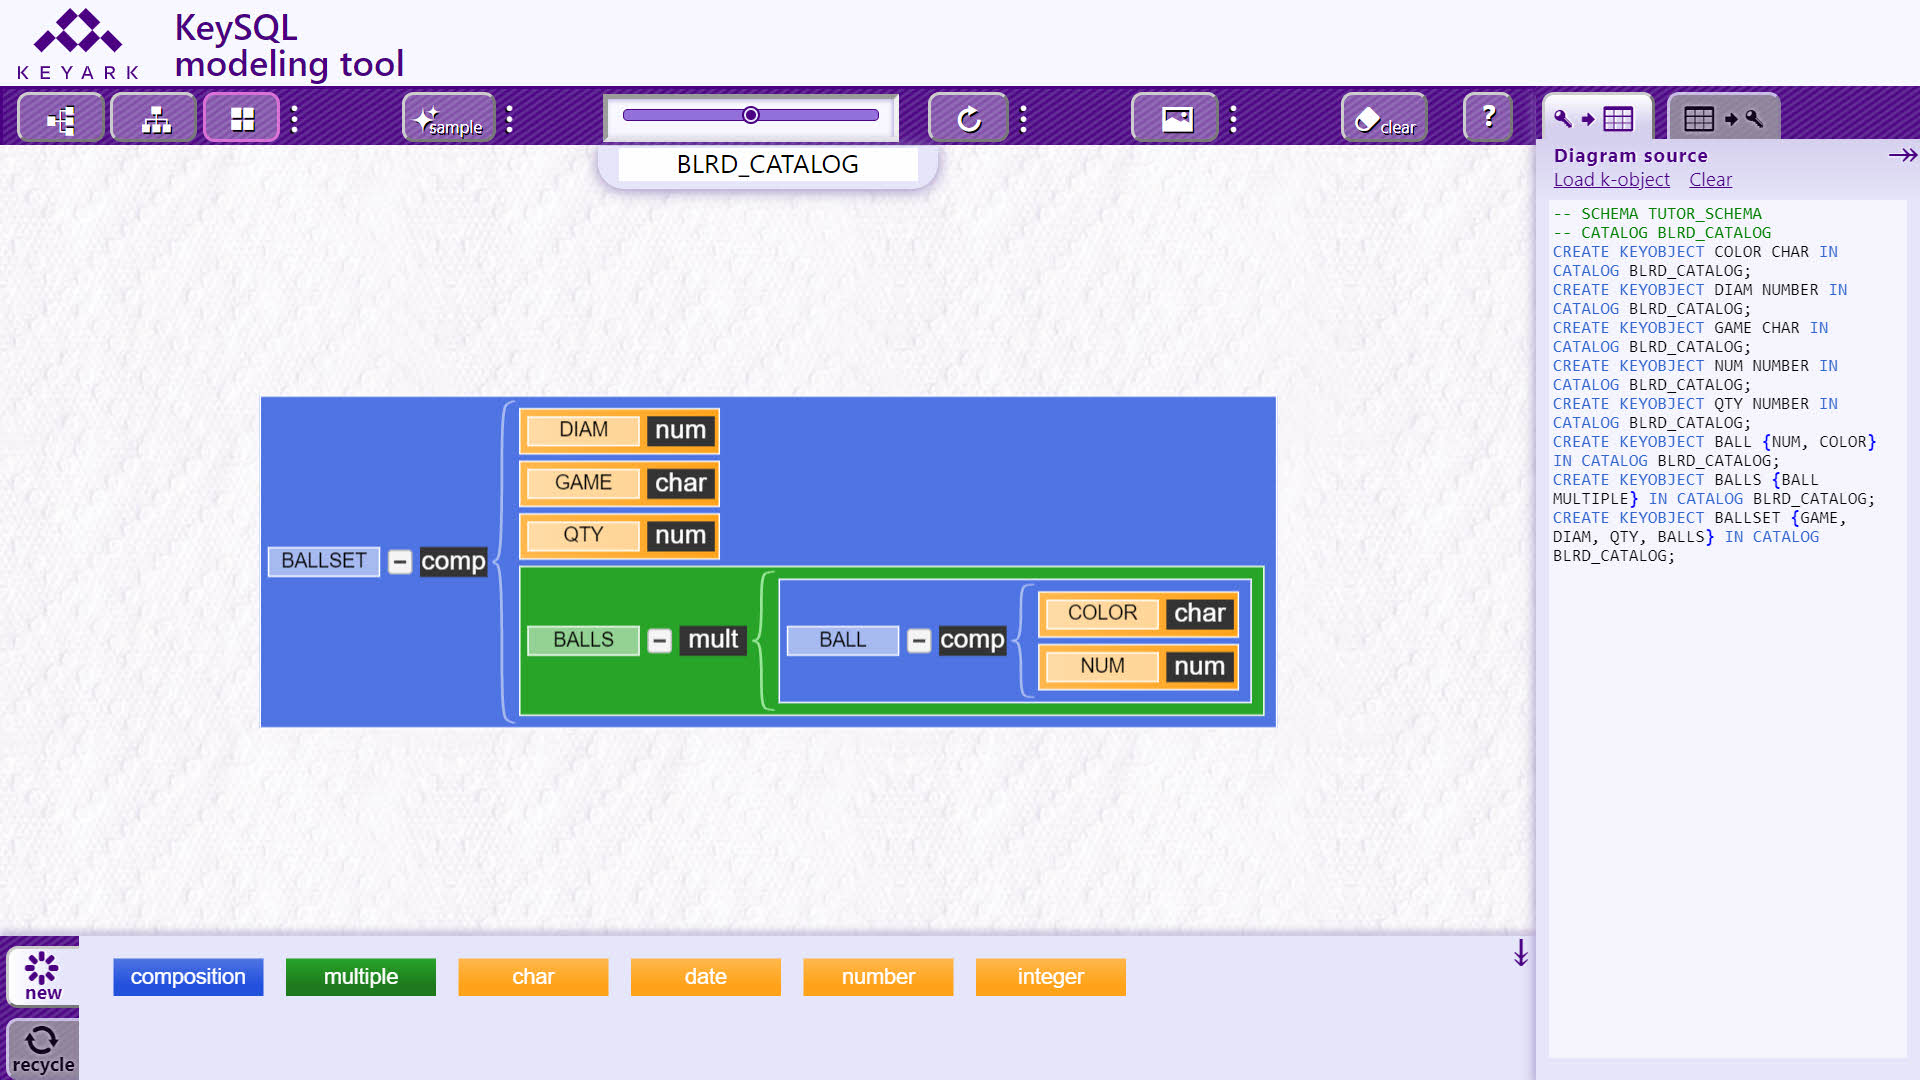
The layout buttons at the top left provide for toggling between three layouts:
In addition to the Horizonal layout shown so far, here is the Vertical layout:
And the Nested layout:
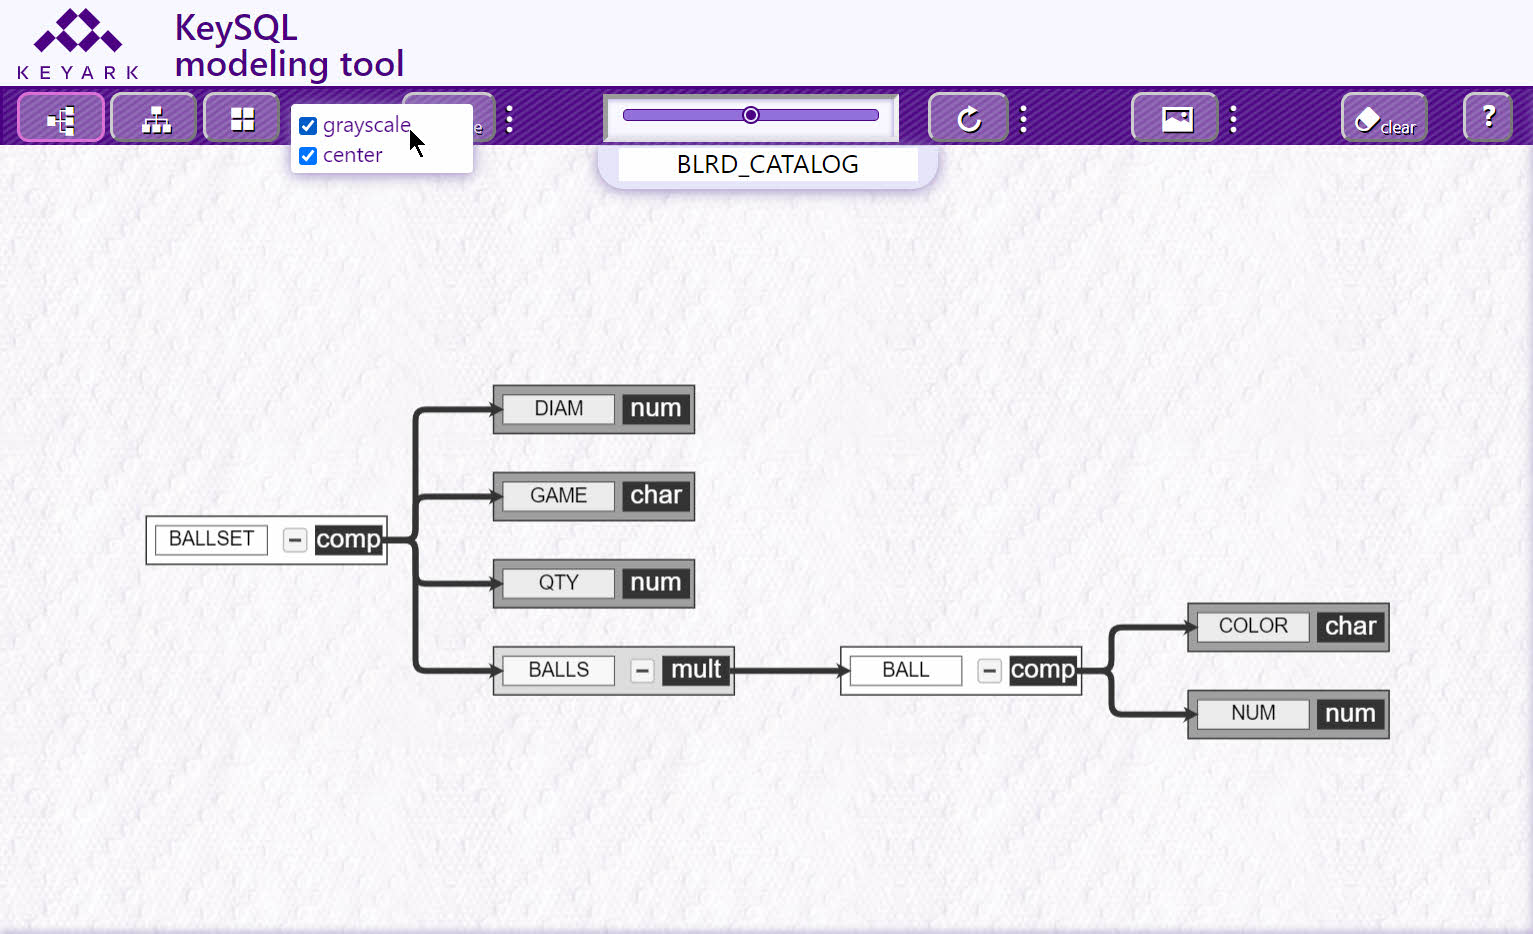
Clicking the three stacked dots at the far right displays additional options:

Here is a model with the default Horizontal layout, but switched to gray scale:
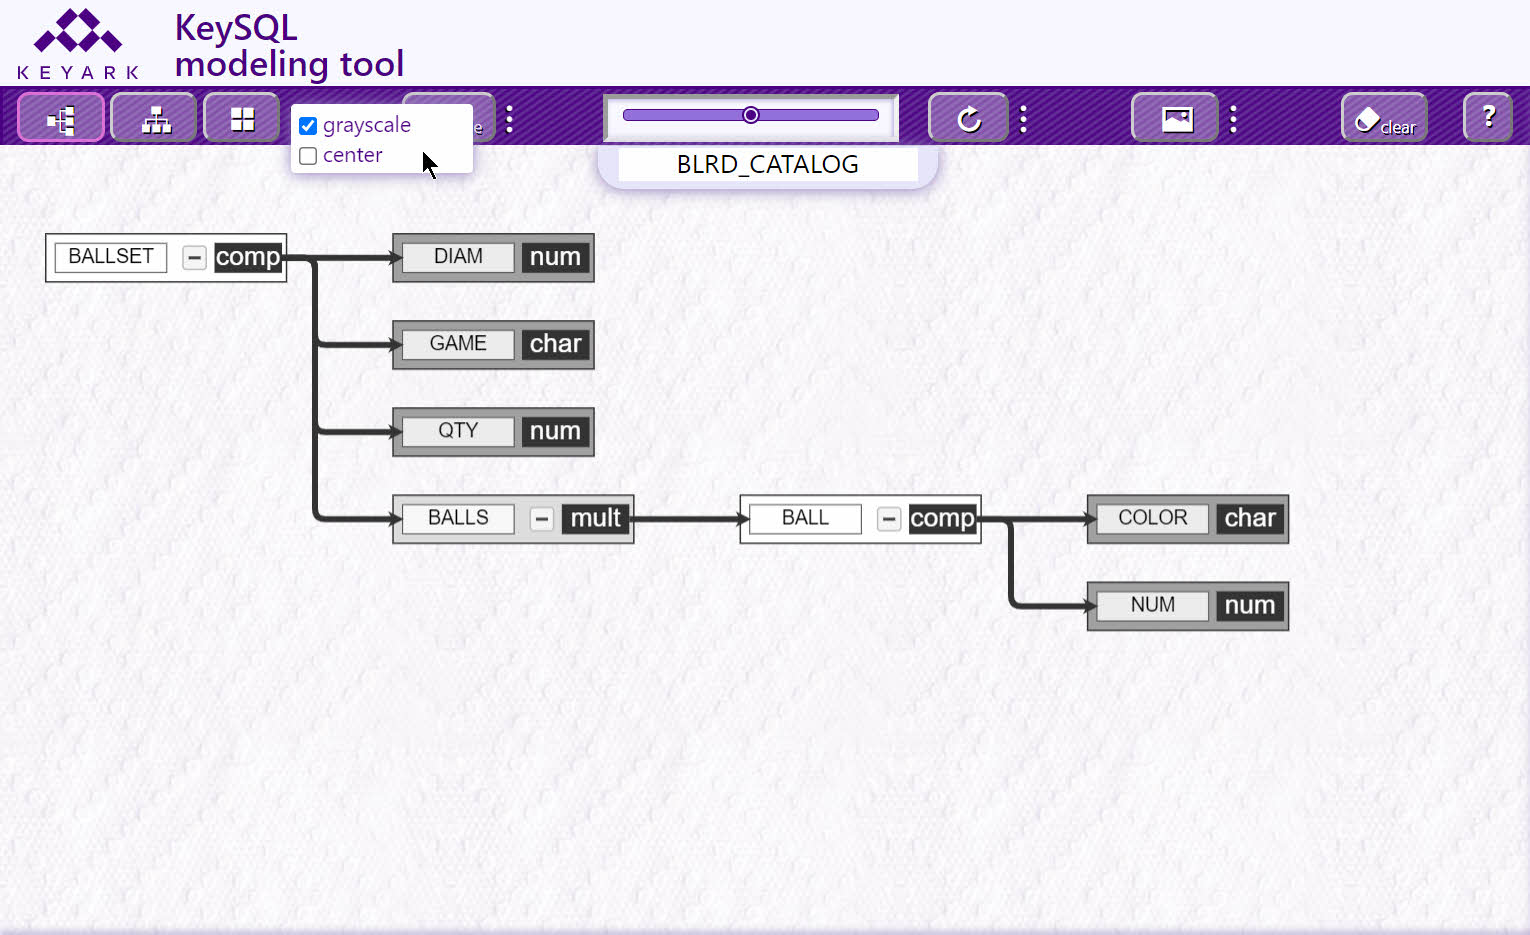
And now center is unchecked, causing the model to appear left and top flush:
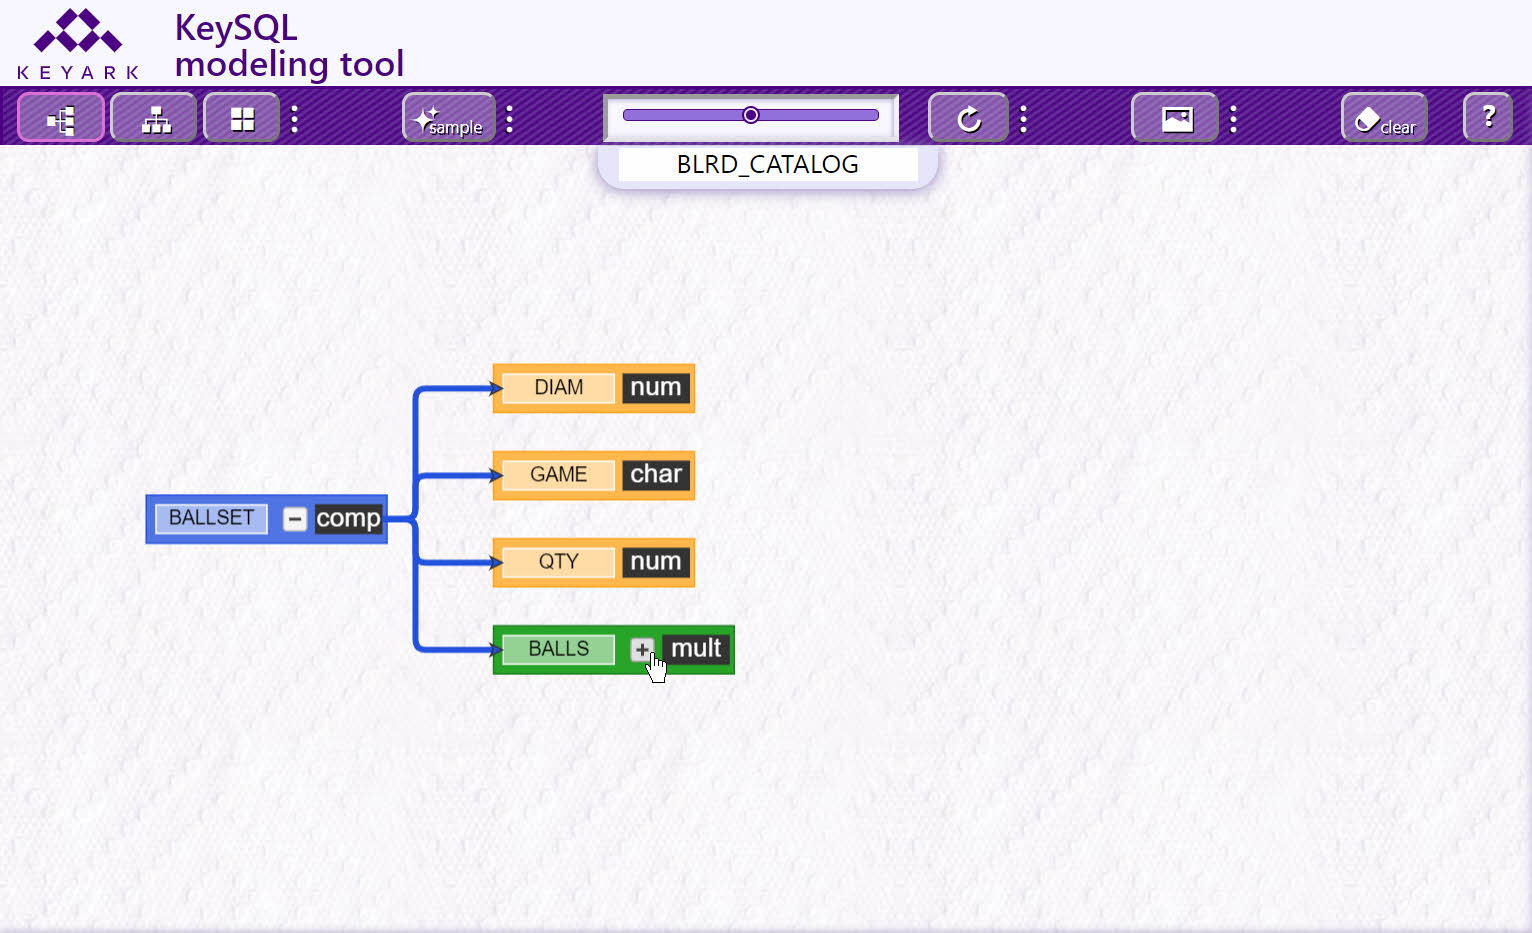
In most cases there is no need to adjust the Zoom (magnify) the model display because you can selectively expand and compact composites.
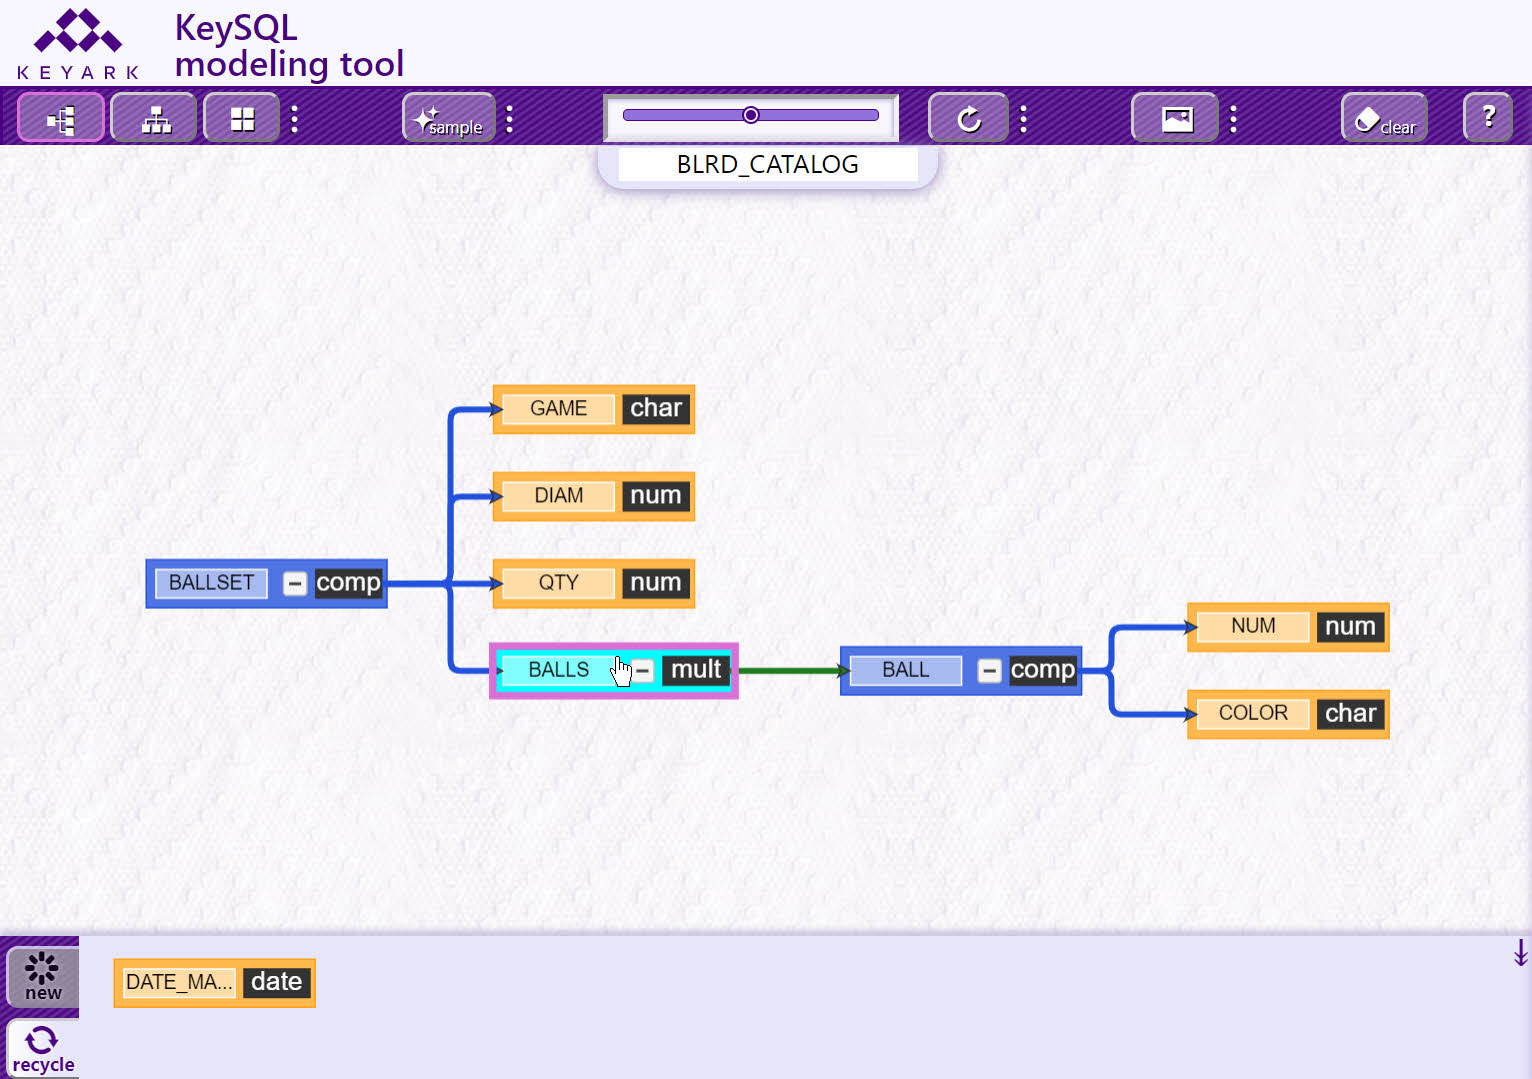
In the screenshot below, the cursor is placed over the minus sign (-) for the green BALLS multi-composite. The minus sign indicates this k-object can be compacted to hide detail:
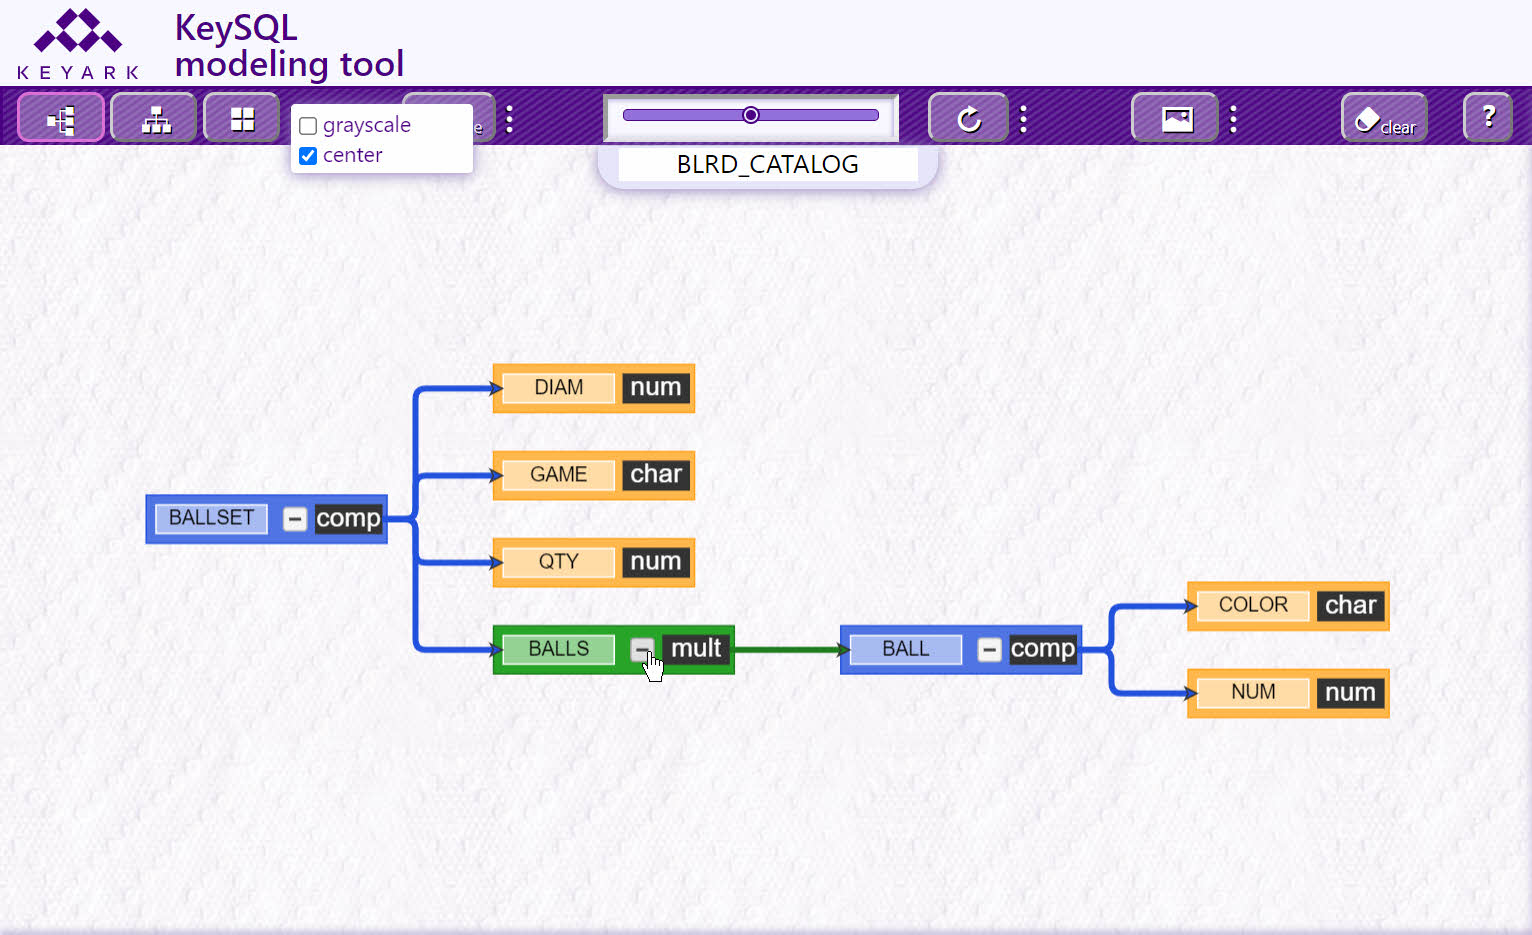
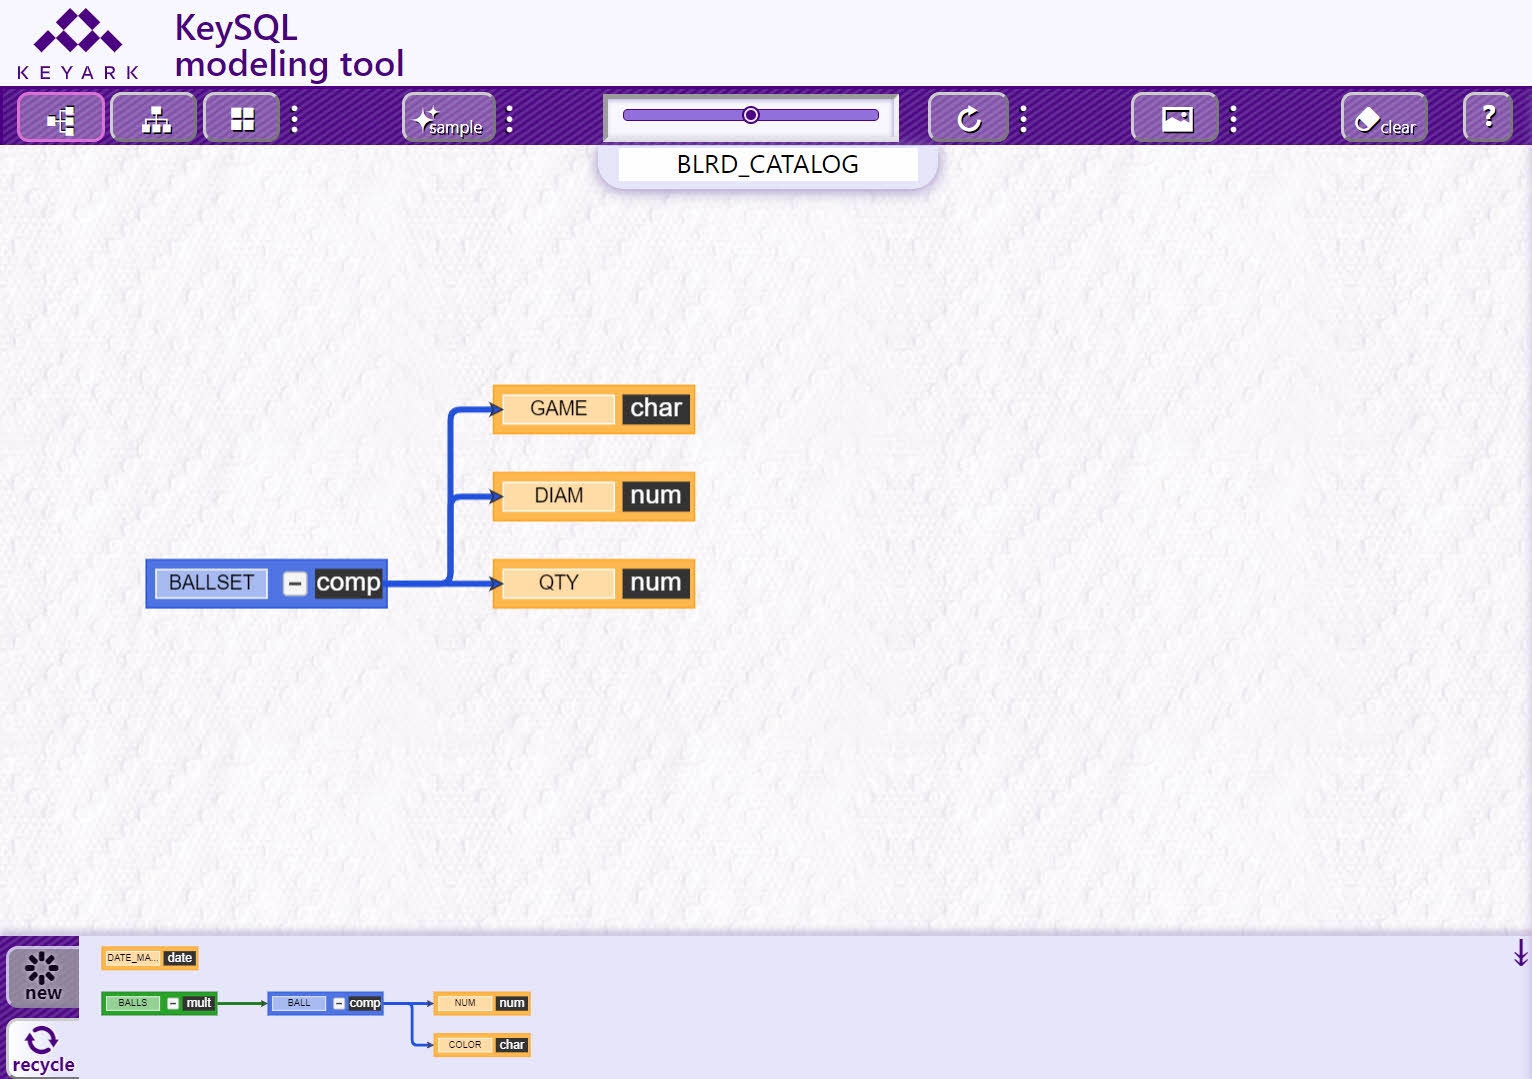
This screenshot shows the model with the BALLS multi-composite k-object shown as compacted. Note that a plus sign (+) now appears, indicating that the BALLS k-object can be expanded to show detail:

The third group of controls serve to adjust the Zoom (magnification) of the model within the model campus and will also 'refresh' the model such that it has a pleasing, consistent layout.
FYI: When the model is refreshed, the KeySQL code displayed in the KeySQL result tab will also be refreshed.
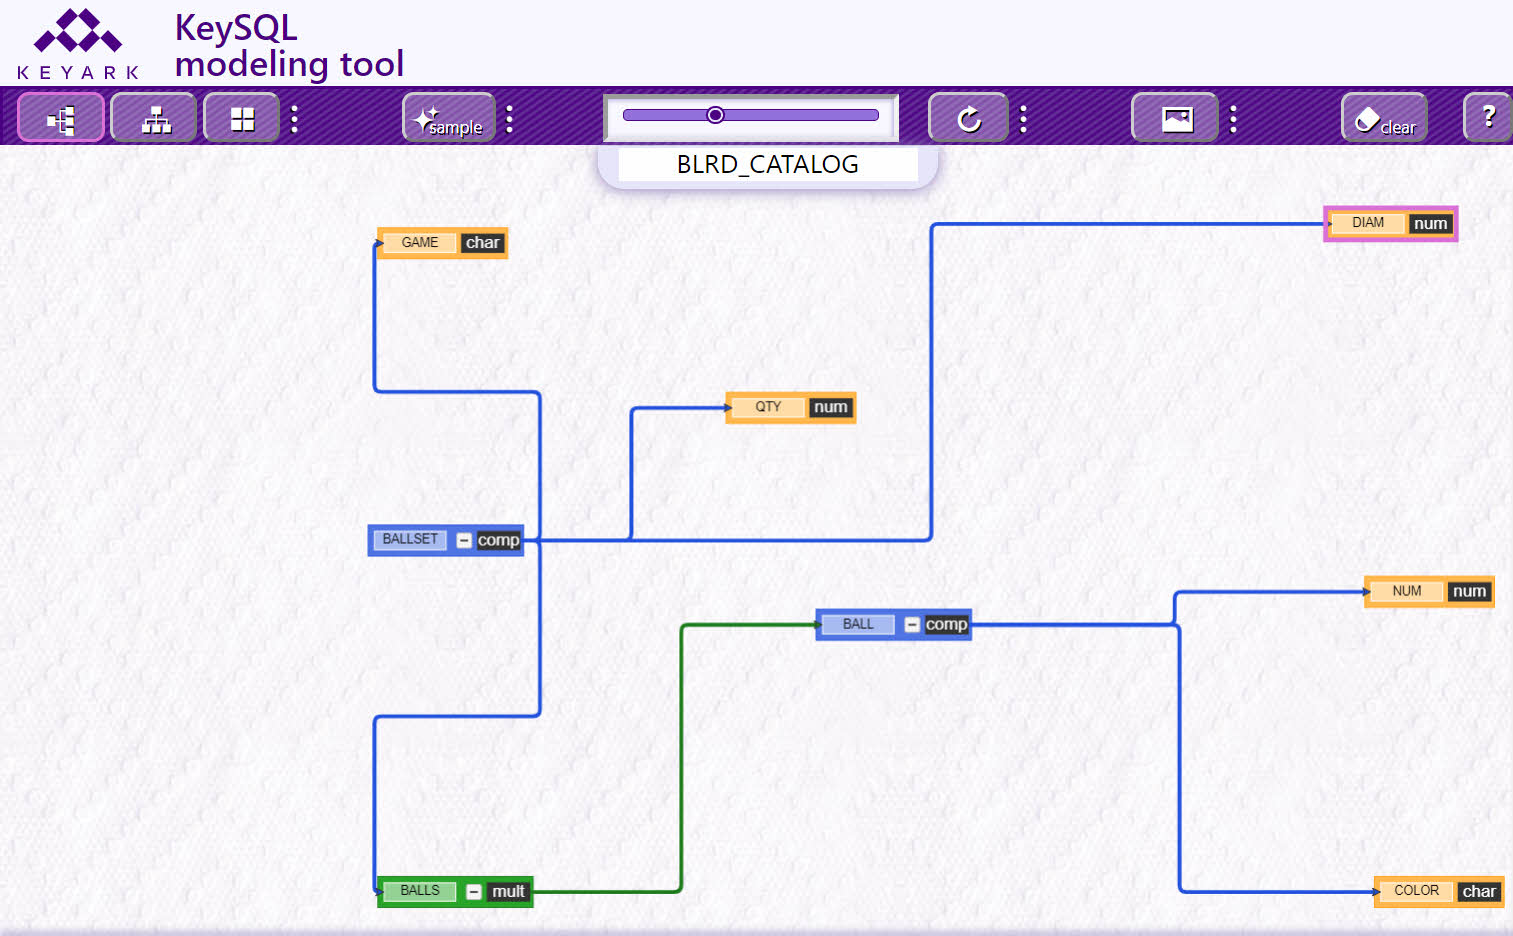
Note how the zoom slider has been adjusted to the left, leaving ample space for adding more k-objects to the model. And then several k-objects were dragged to a new position:
Clicking the Refresh button, shown below, rearranges the model to a pleasing, consistent look:

FYI: The first click of Refresh establishes horizontal symmetry, and the second click establishes vertical symmetry. If you did a manual layout, such as shown in the prior screenshot depicting Zoom, your custom positioning will be undone.
Clicking the three dots reveals the automatic refresh option:

By checking the auto refresh check box, the model refresh is automatic. The means that after you re-arrange k-objects, including addition and deletion, your diagram will automatically adjust for a pleasing look.
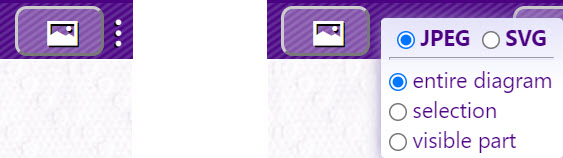
You can output the model as either a JPEG or SVG image file which can then be printed or shared. And you can choose to output either the entire diagram, just the selected k-object, or just the part of the diagram visible without scrolling:
The Model name is shown just below the Refresh button. The default name is the same as the catalog. You can change the Model name by clicking in the Model name text area. When you click outside the text area, the name will be preserved.

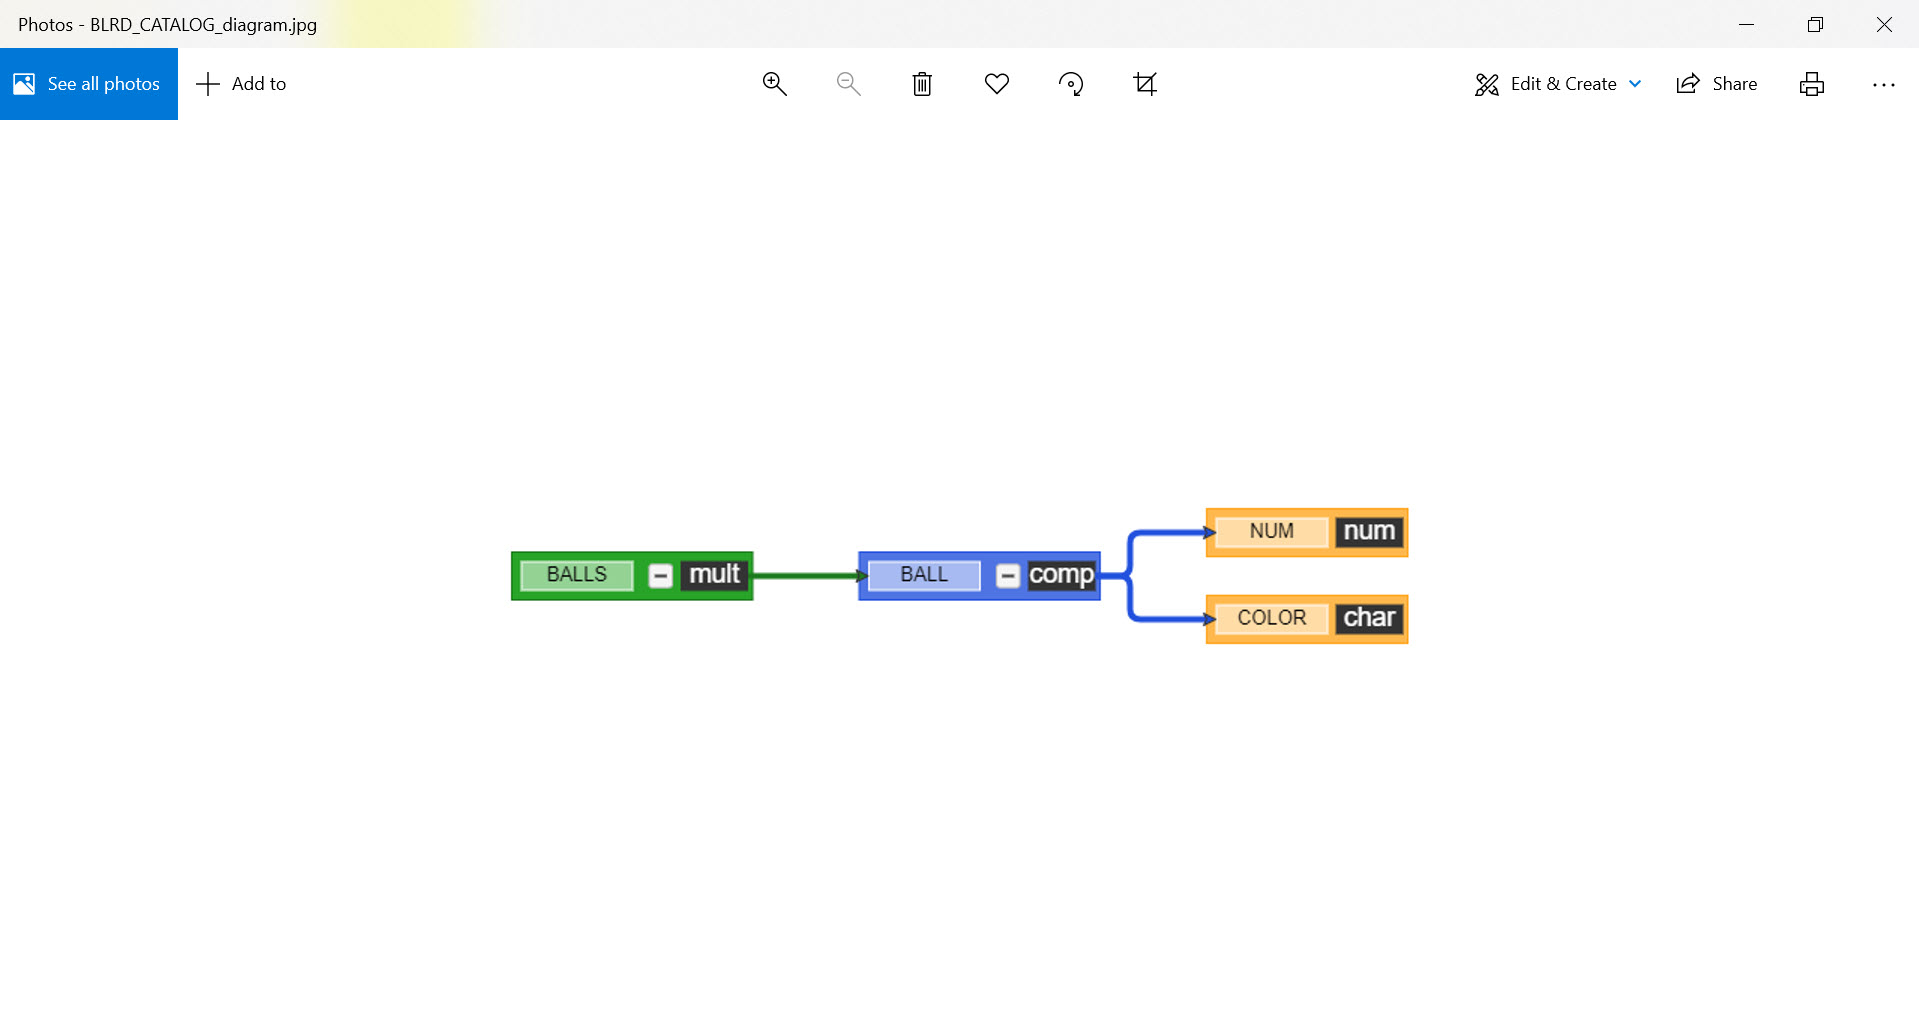
Click either the jpg or svg button to save as that file type. A file will be written to your browser's download folder, with a name like BLRD_CATALOG_diagram which concatenates the model name + ' _diagram' .
By default, the entire diagram checkbox is selected. This causes the entire data model to be output to a graphics file. To output only selected k-objects, choose selection. You can lasso a rectangular area, selecting k-objects entirely within that area, via a mouse drag, as shown below:
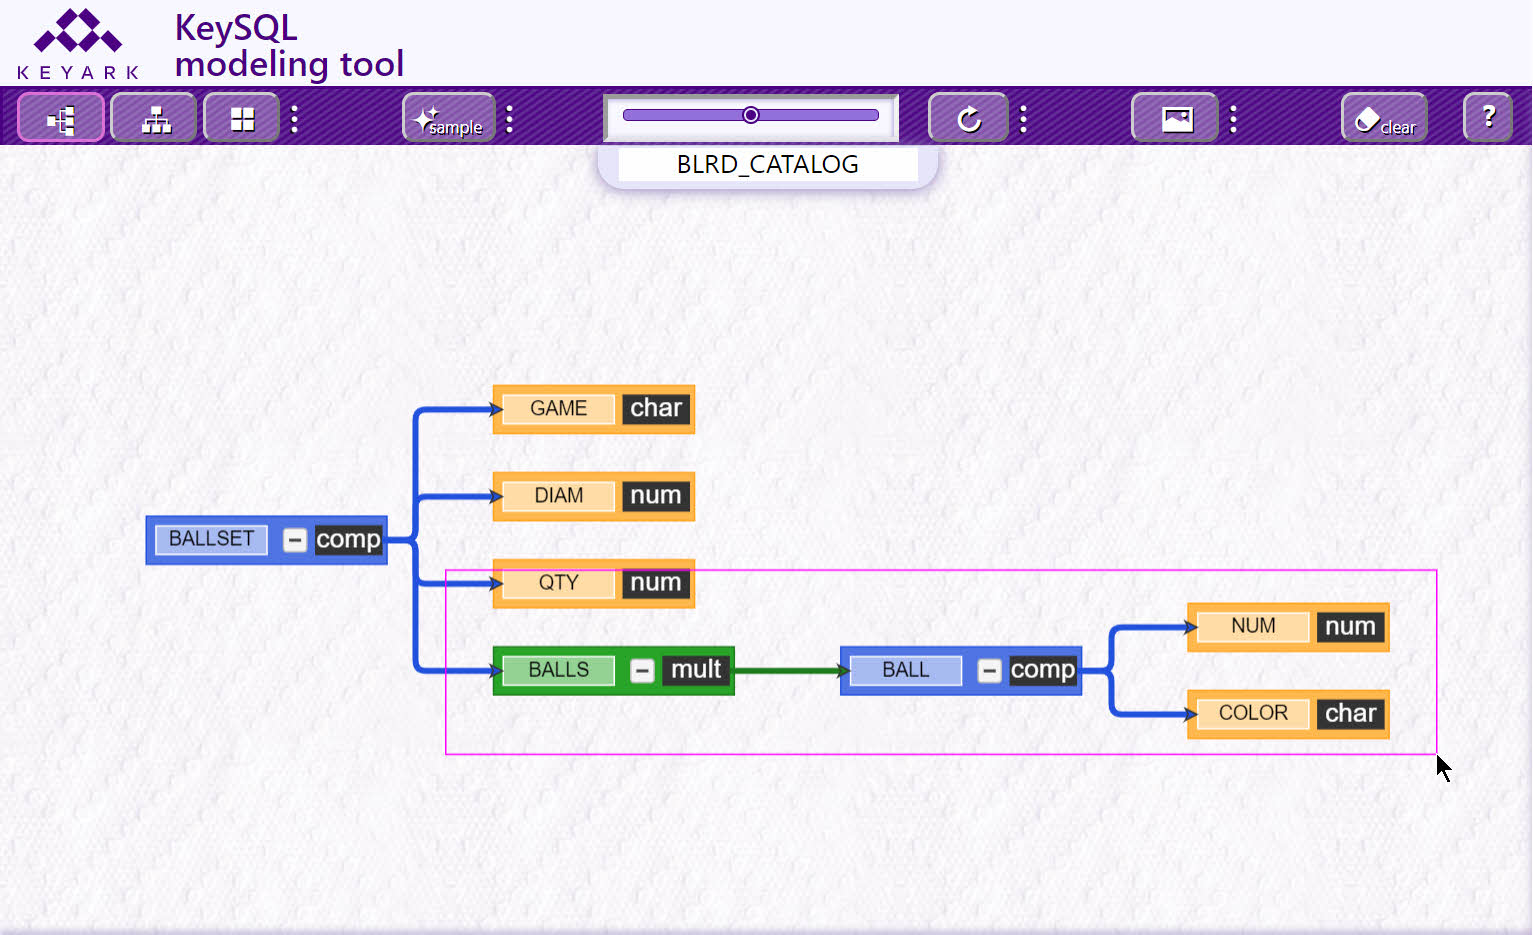
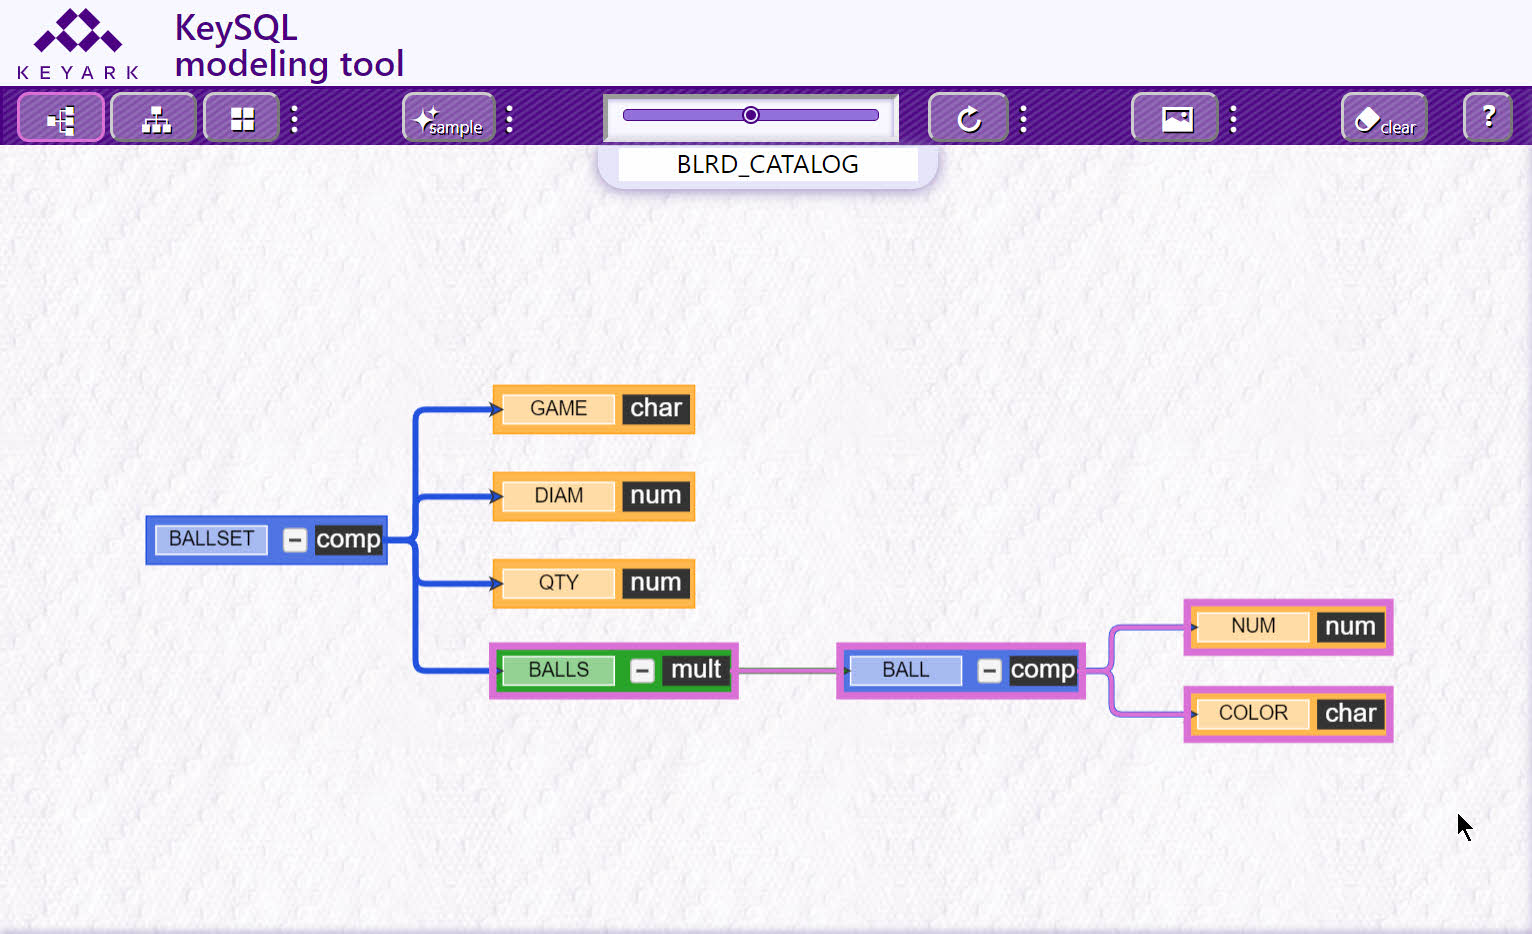
Once you ' let go' of the selection, all k-objects (and connectors) that were totally contained within the orchid color rectangular lasso are then shown with an orchid boundary, as shown in the next screenshot:
Tip: To select by this rectangular lasso, rather than inadvertently drag, make certain to click on the canvas, not on a k-object. Do a regular click (left click), pause and then move the cursor to the opposite end of the rectangular region you wish to select. Then release the mouse button.
These are the sole k-objects that will be printed to the graphics file:
This section explains the most basic operations for how to alter the data model, adding and removing k-objects. It's also possible to create a data model from scratch. During this tutorial, you will be exposed to the Recycle tab, an efficient aid in building a complex data model by re-use of existing components. See 1.6 Advanced Techniques for more advanced techniques.
FYI: The Data Modeling Tool supports 'undo'
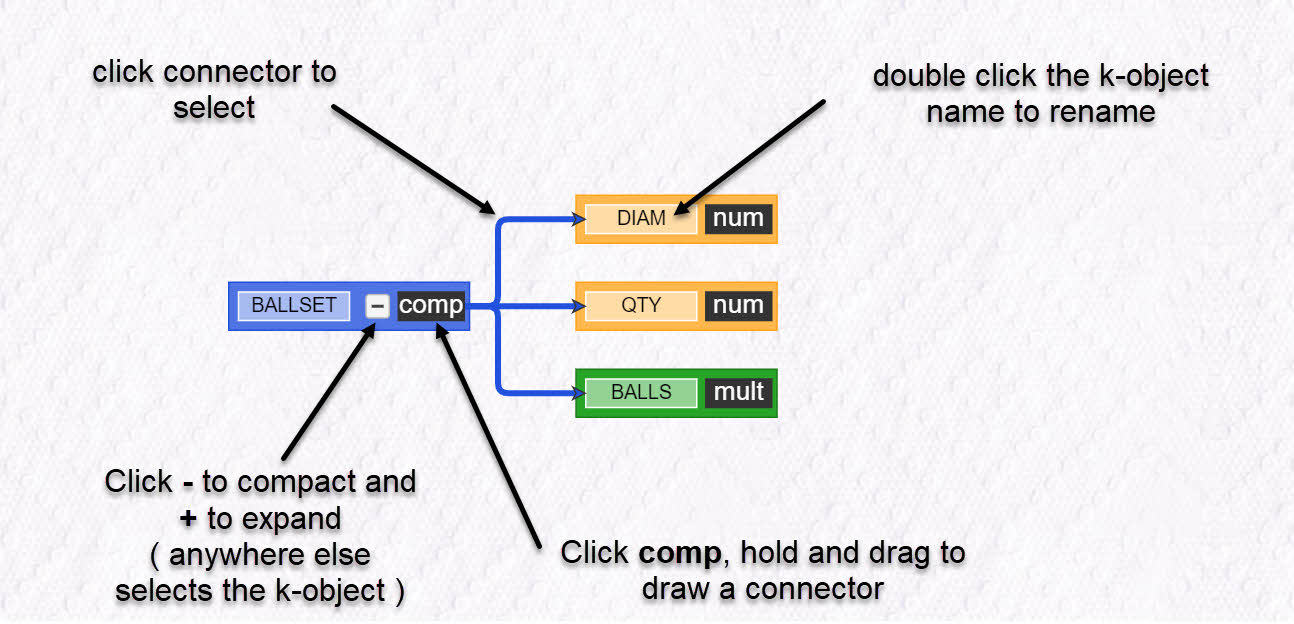
The following screenshot provides a quick reference for where to click and double-click on the model:
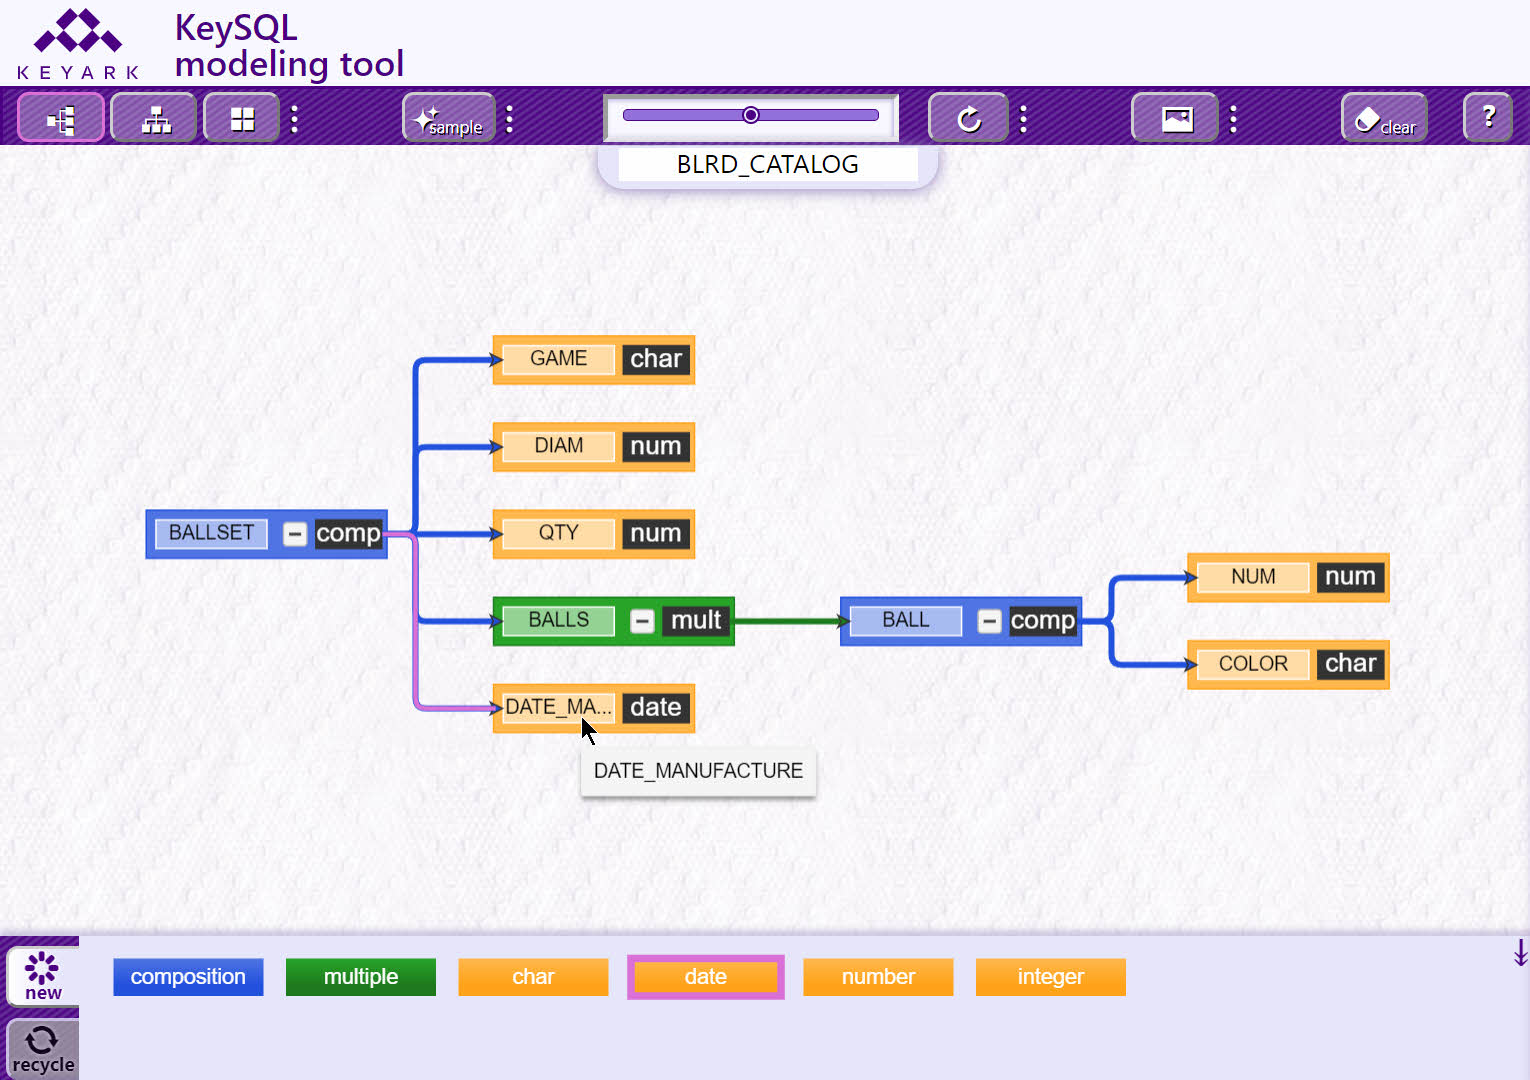
The screenshot below captures the moment that a new date k-object is being dragged from the new tab, a palette of four elementary objects, plus composition and multi-composition, with which any data model can be constructed:
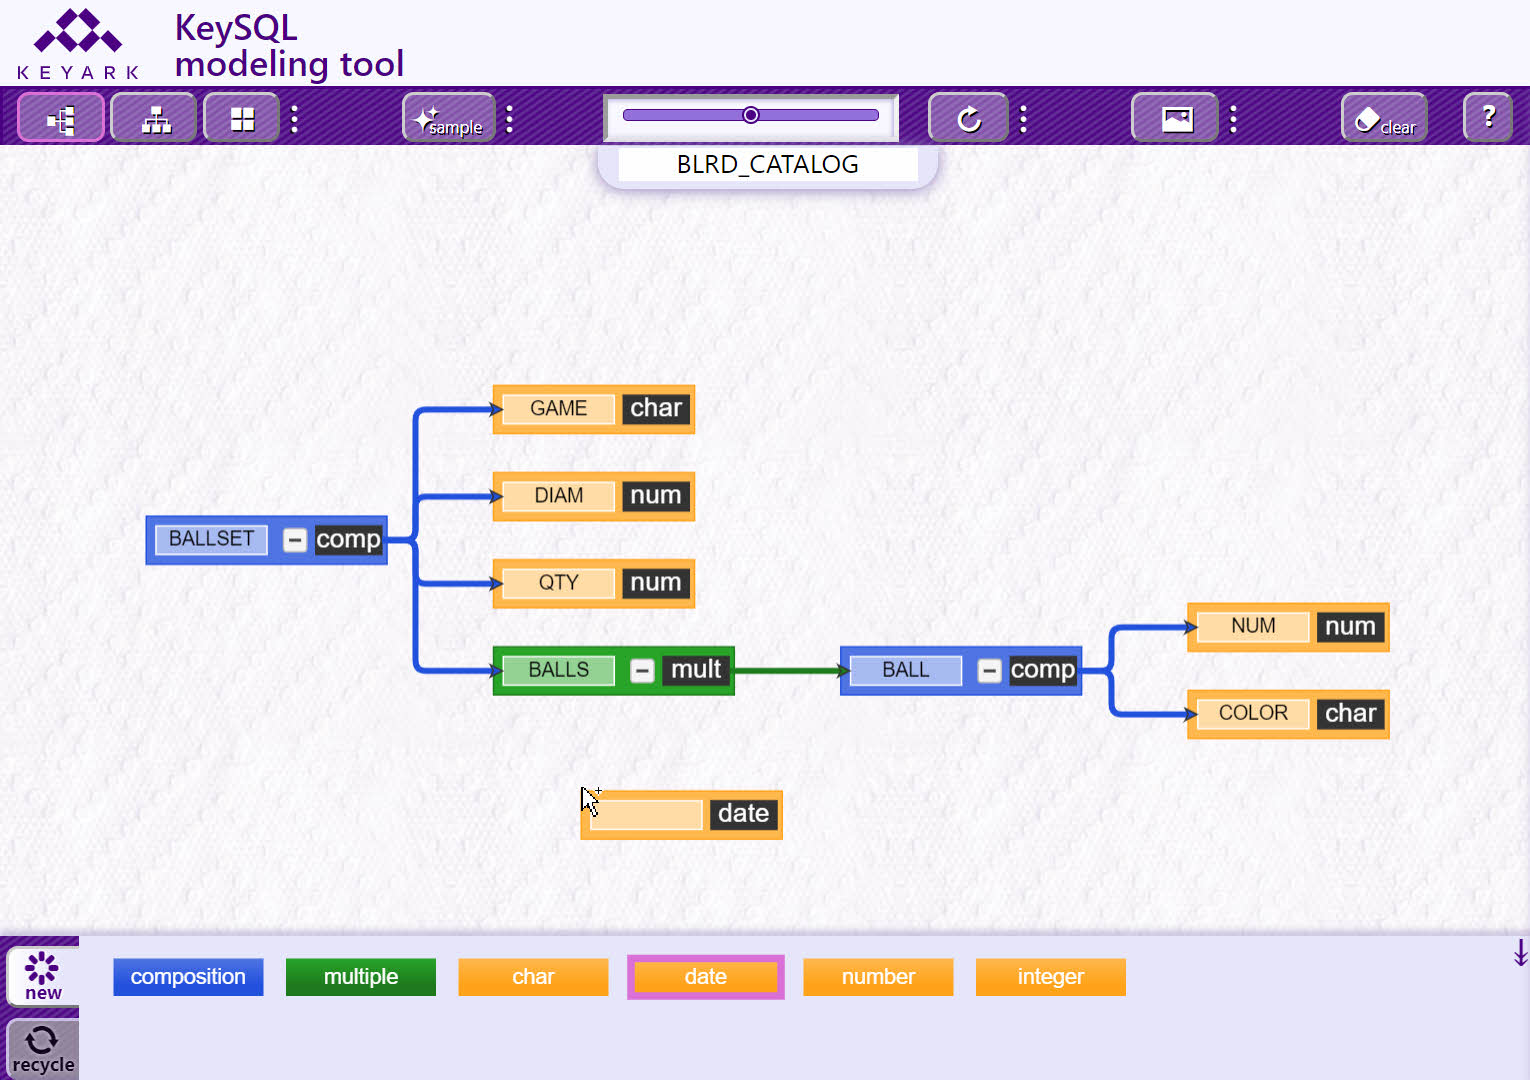
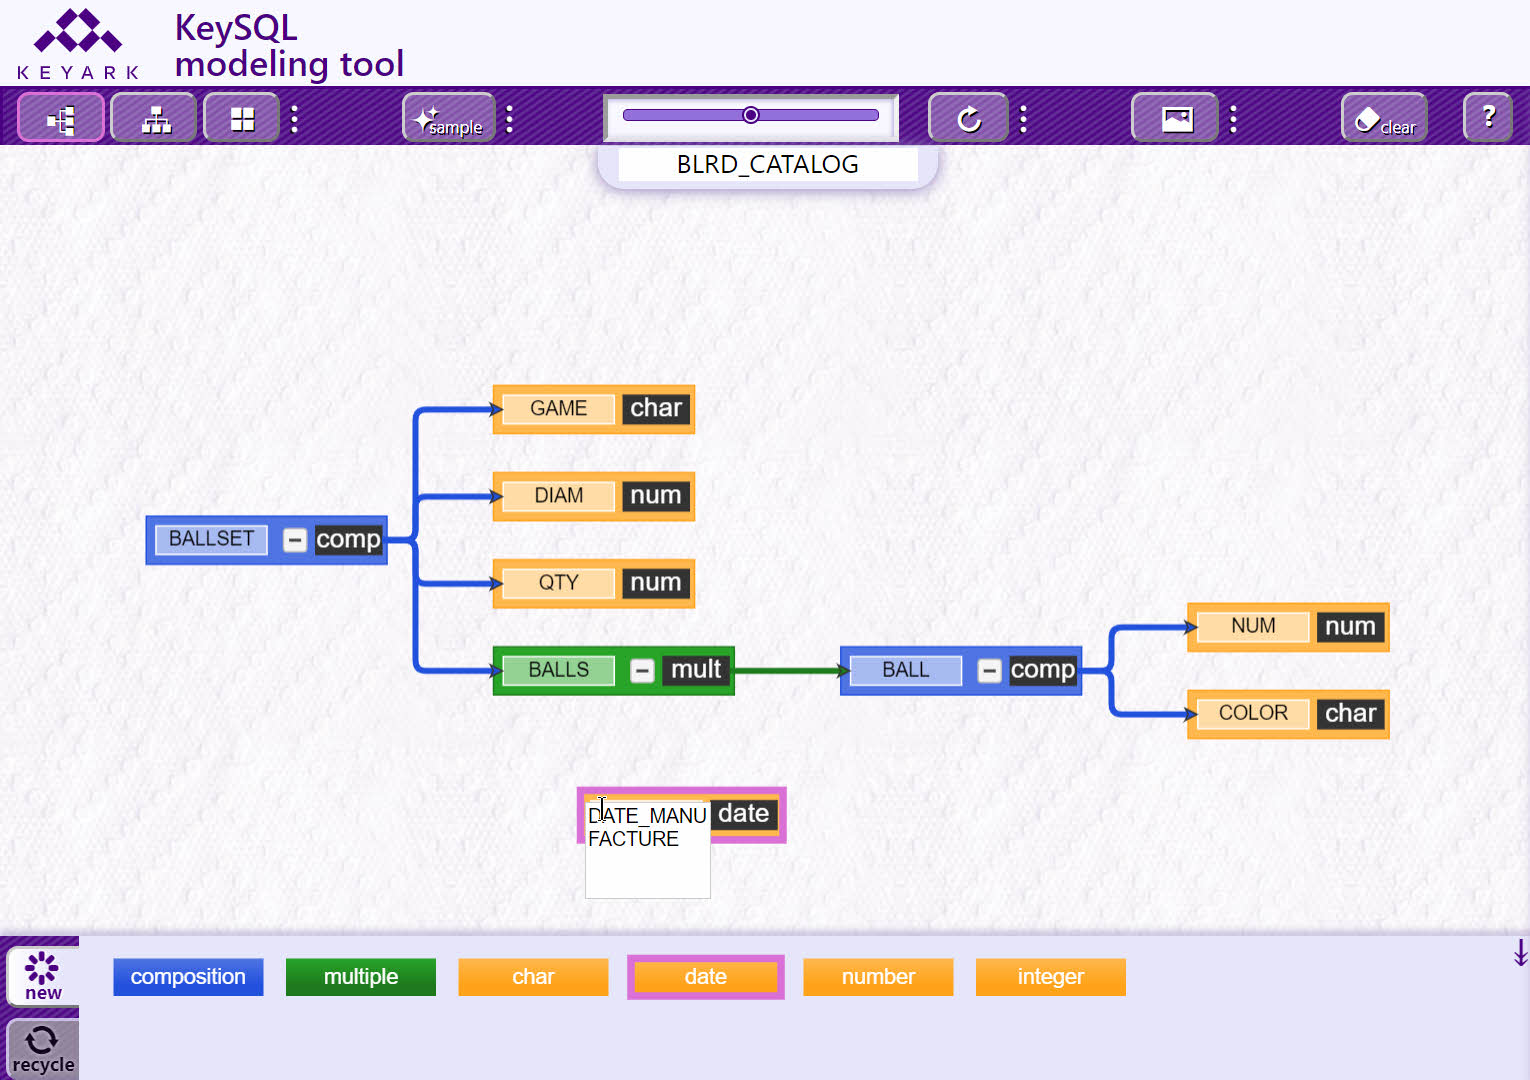
After being dragged onto the model canvas, double click on the blank name text area, and type the k-object name. In this case it is DATE_MANUFACTURE. Click outside the k-object to complete:
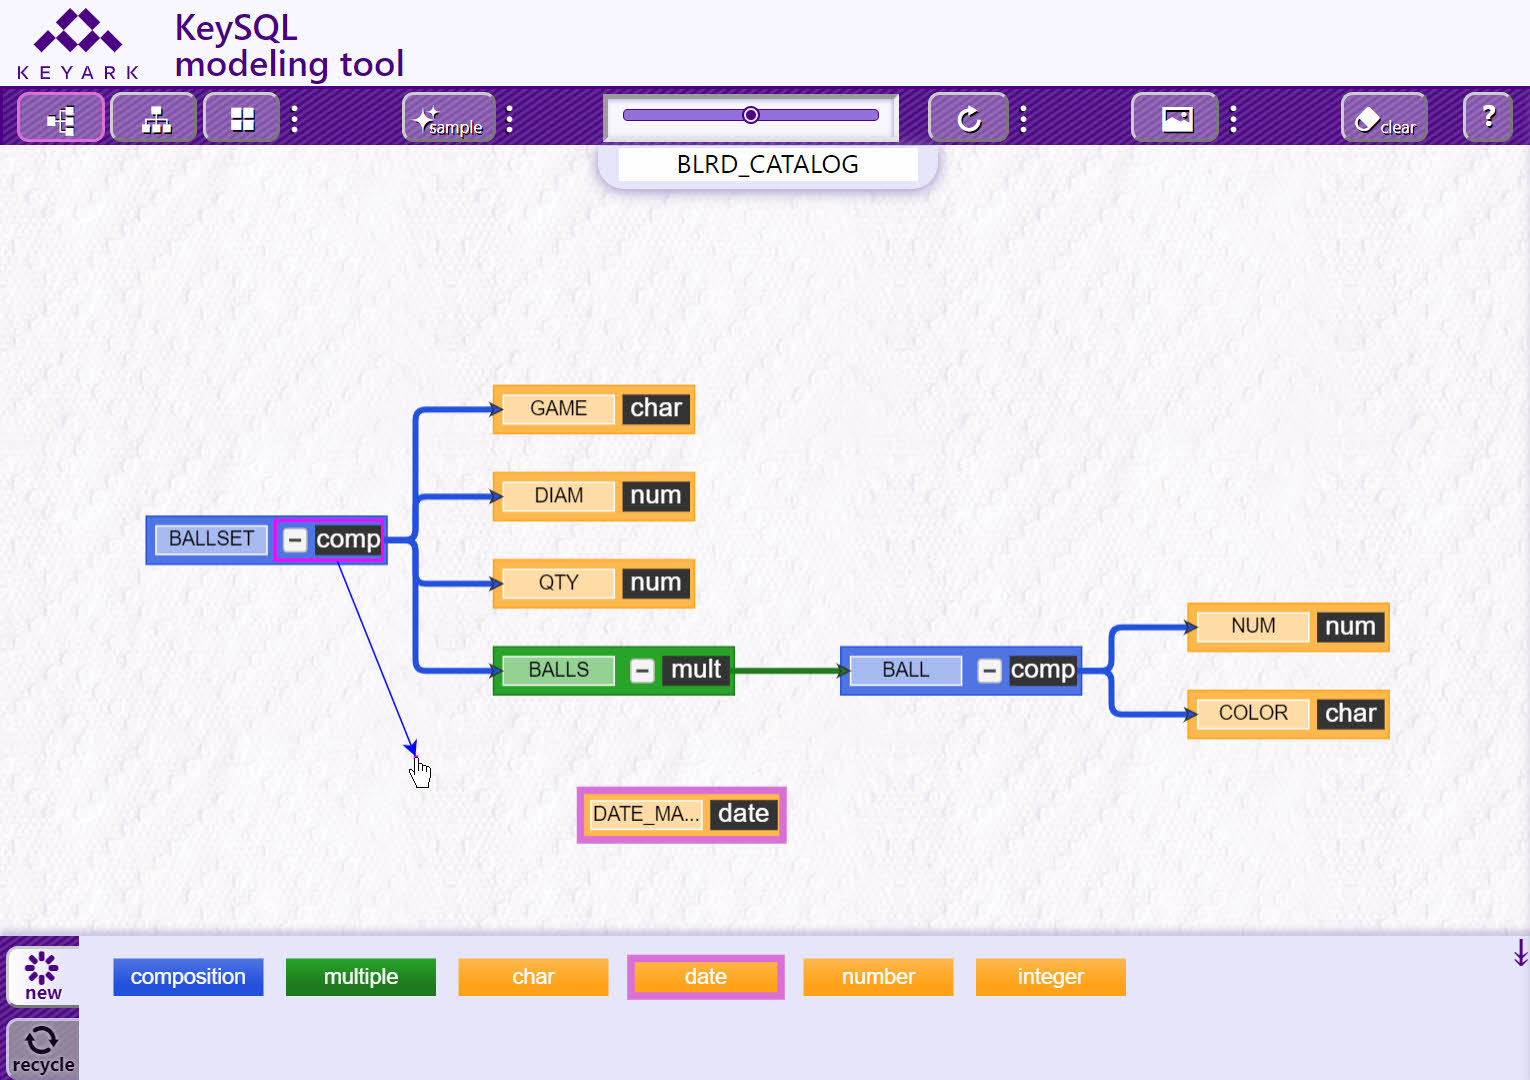
The next step is to connect the DATE_MANUFACTURE date object to a composition k-object. To do so, place your cursor over the object type descriptor comp in the chosen composition and drag, which causes a connecting element to appear:
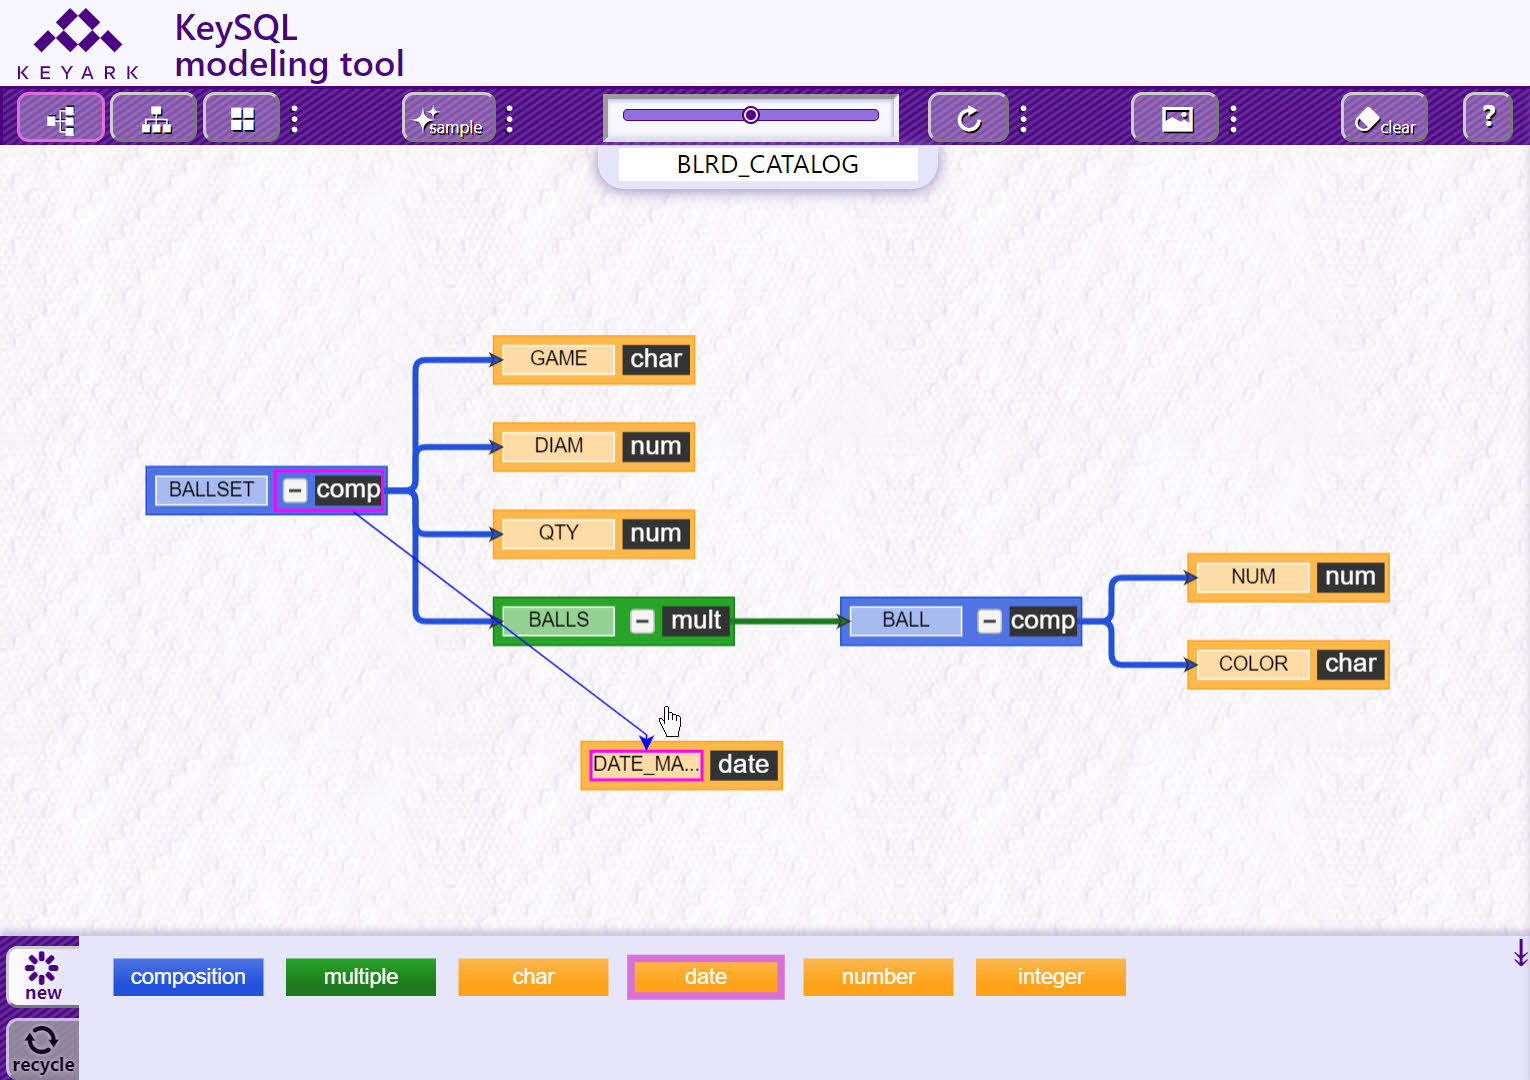
When you drag the connecting line close to the DATE_MANUFACTURE elementary k-object, the line will snap in place:
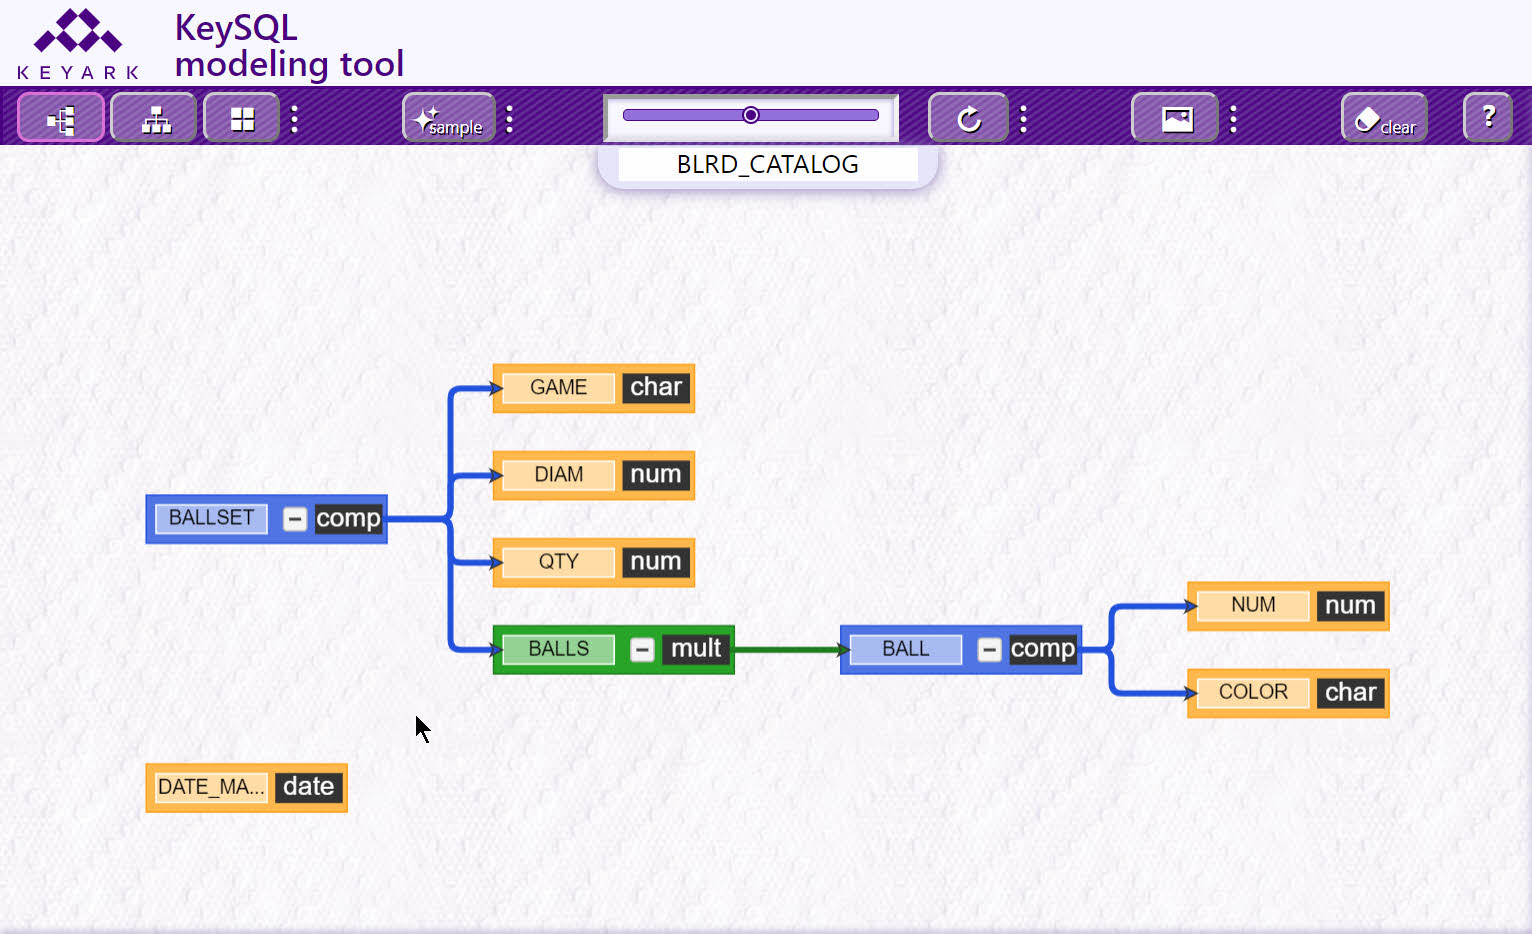
If the tool does not automatically adjust for a pleasing alignment, click the Refresh button to force a realignment:
You can remove an individual connector, an individual k-object, or a group of k-objects.
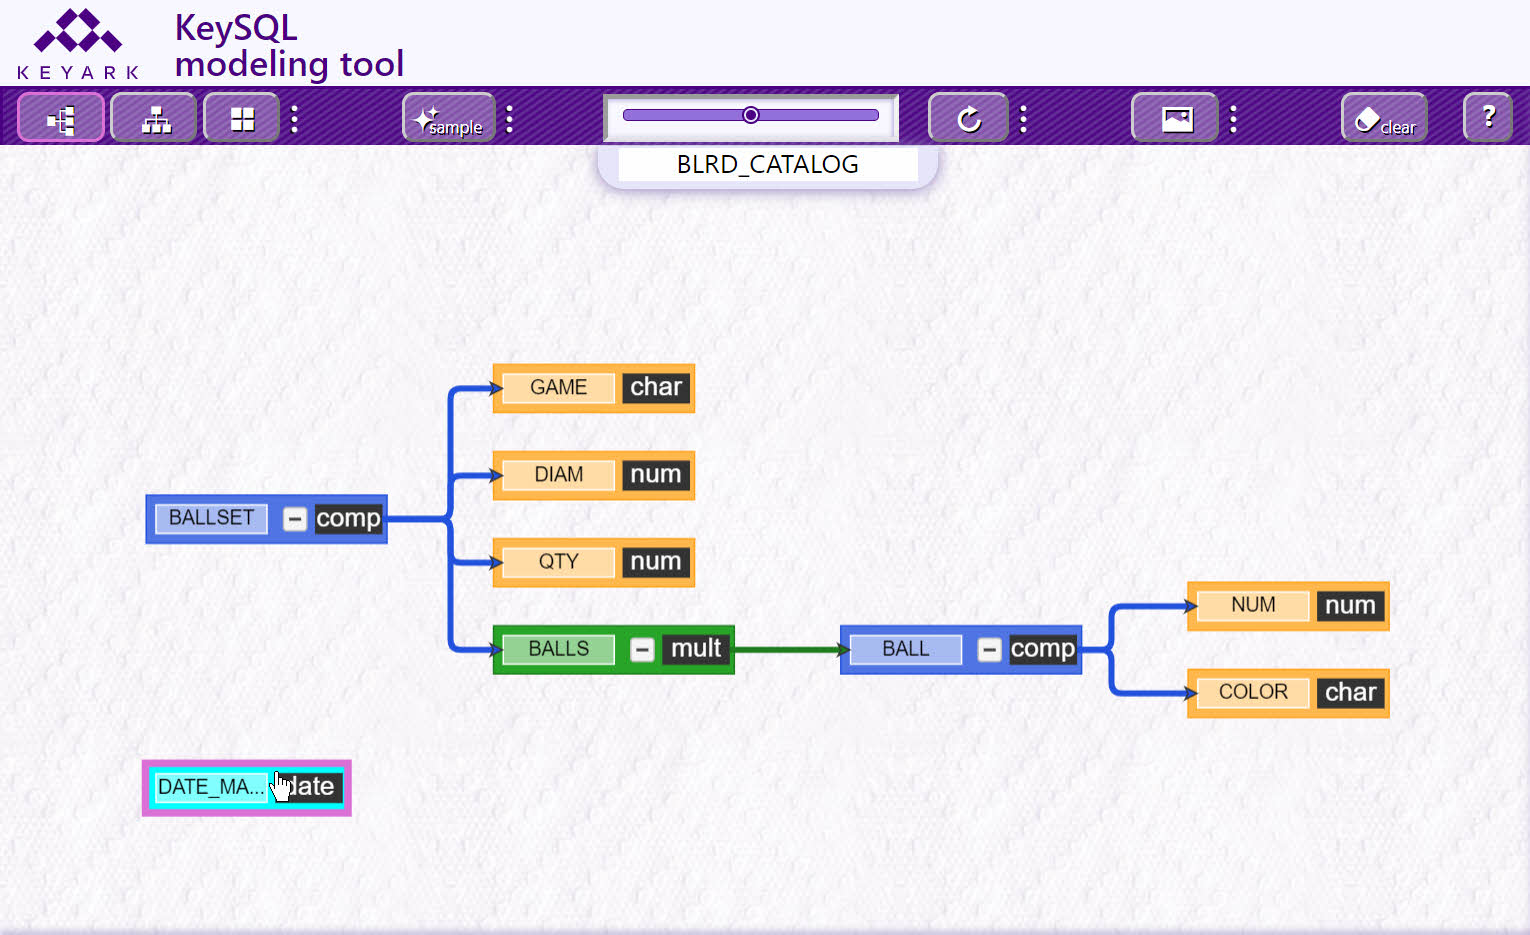
In this example the connector between BALLSET and DATE_MANUFACTURE will be removed, so that DATE_MANUFACTURE can be potentially connected to a different composite. First click on the connector:
Use the Delete key to remove the connector:
The same technique can be employed to split off a branch of the diagram, formed by use of a composite k-object. The branch can then be removed or reattached to another part of the diagram.
Removing an elementary k-object is just as easy. Here we select the same k-object we just added:
The Delete key removes the highlighted k-object:
The original data model, before adding and removing DATE_MANUFACTURE, is restored. Note one difference in the tool display. The just removed DATE_MANUFACTURE k-object is shown in the recycle tab, ready for re-use, as will be explained in the next section. It is not shown in this example, but if there was a connecting line, it will be automatically removed as well.
Removing a branch of a tree is accomplished by selecting the multi-composite or composite k-object that defines that branch:
When you click the Delete key, the branch is moved to the recycle tab, available for attaching elsewhere:
To remove a group of k-objects, lasso a group of contiguous k-objects. Then click the Delete key. All elements both k-objects and connectors that are completely contained within the rectangular lasso will be removed.
FYI: There is no mechanism to select individual elements via use of special keys such as Alt or Ctrl.
The screenshot below shows the data model with the addition of a newly created WEIGHT k-object in two locations, part of both BALLSET composite and BALL composite.
Look for the black mouse cursor on WEIGHT. That k-object was selected by a single mouse click:
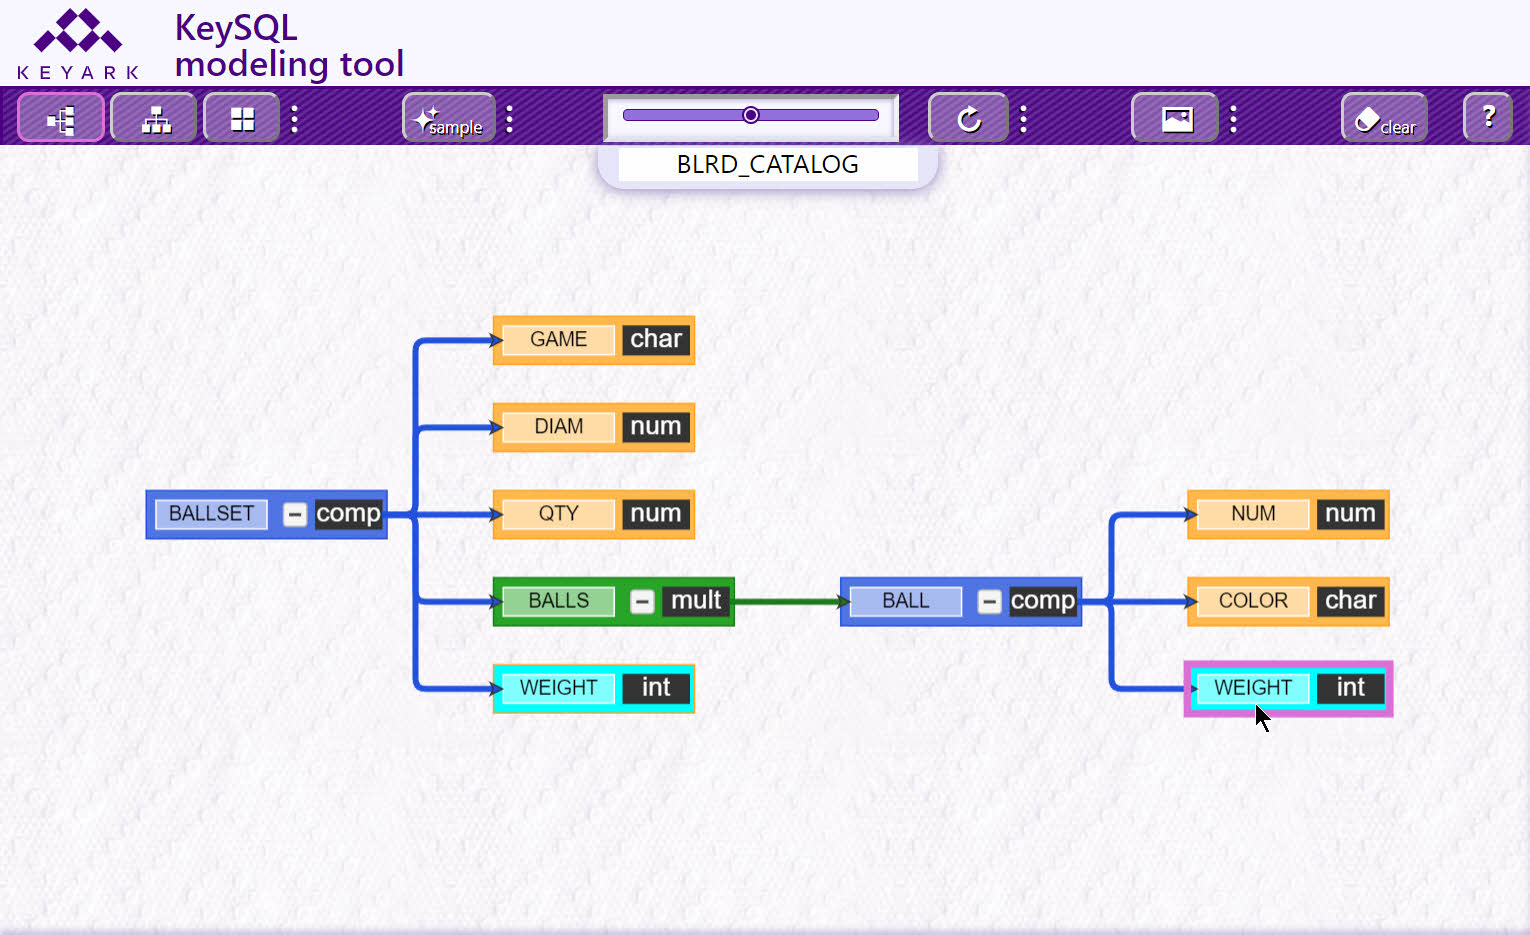
As usual, the tool denotes the selected k-object with an orchid boundary and by changing the interior color to aqua. Note how all other occurrences of WEIGHT are made readily apparent by use of the same aqua coloration.
Once a k-object has been deleted from the model, it becomes visible in the recycle tab. Same as new k-objects in the new tab, you can drag an object from the recycle tab to the model canvas.
To toggle between the new tab and the recycle tab, click on the desired tab.
Tip: If the recycle tab becomes too crowded, you can select and delete k-objects that are no longer necessary.
The model canvas can be cleared by selecting the clear button:

This also clears the recycle tab.
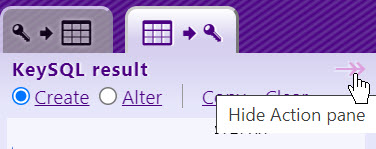
To provide for a more spacious viewing area, the model canvas can be enlarged by hiding the Action pane on the right, as well as hiding the k-object Tabs on the bottom.
The Action pane is hidden by clicking on the horizontal double headed arrow pointing to the right:
Once hidden, it is revealed by clicking double headed arrow pointing to the left:
The k-object Tabs are hidden by clicking the vertical double head arrow that points down:

Once hidden, the Tabs are revealed by clicking double headed arrow that points up:

The Action pane contains two tabs:
The screenshot below shows the Diagram source tab, which presents the KeySQL statements that represent the data model as it was first read by the tool. Note that the CREATE KEYOBJECT commands map one-to-one with the k-objects you see in the model diagram:
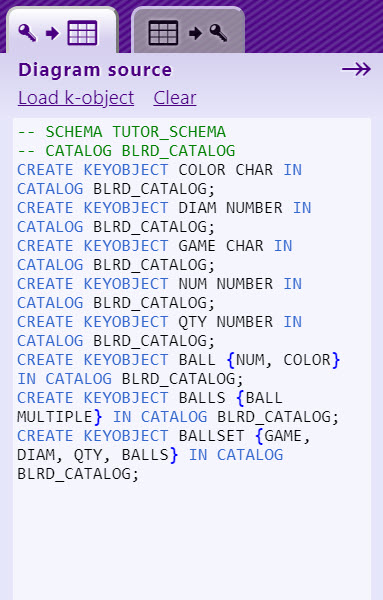
FYI: These commands are the same commands generated using KeySQL Studio's K-objects export command.
This Action tab includes a few controls:
|
Control |
Purpose |
Notes |
|
|
Load a fresh data model, showing the commands in the Diagram source tab that reflect the initial state of the model. |
Loads all or part of an existing Catalog. A pop-up form appears for specification of the schema, catalog, and optionally a (composite) k-object within the catalog. |
|
|
Clear the current data model, so you can begin afresh. |
|
|
|
Hide the Action pane |
Allows for a large area for display of the diagram |
|
|
Reveal the Action pane |
Allows for a large area for display of the diagram |
This Action tab includes a few controls: `
|
Control |
Purpose |
Notes |
|
|
Shows KeySQL CREATE statements for this model |
Execution of these statements by KeySQL Studio would create a Catalog that matches the Model |
|
|
Shows KeySQL ALTER statements for this model |
Execution of these statements by KeySQL Studio would modify the original catalog, which served as the starting point, to now match the Model |
|
|
Copy to your computer's clipboard |
|
|
|
Clear the current data model, so you can begin afresh. |
|
|
|
Hide the Action pane |
Allows for a large area for display of the diagram |
|
|
Reveal the Action pane |
Allows for a large area for display of the diagram |
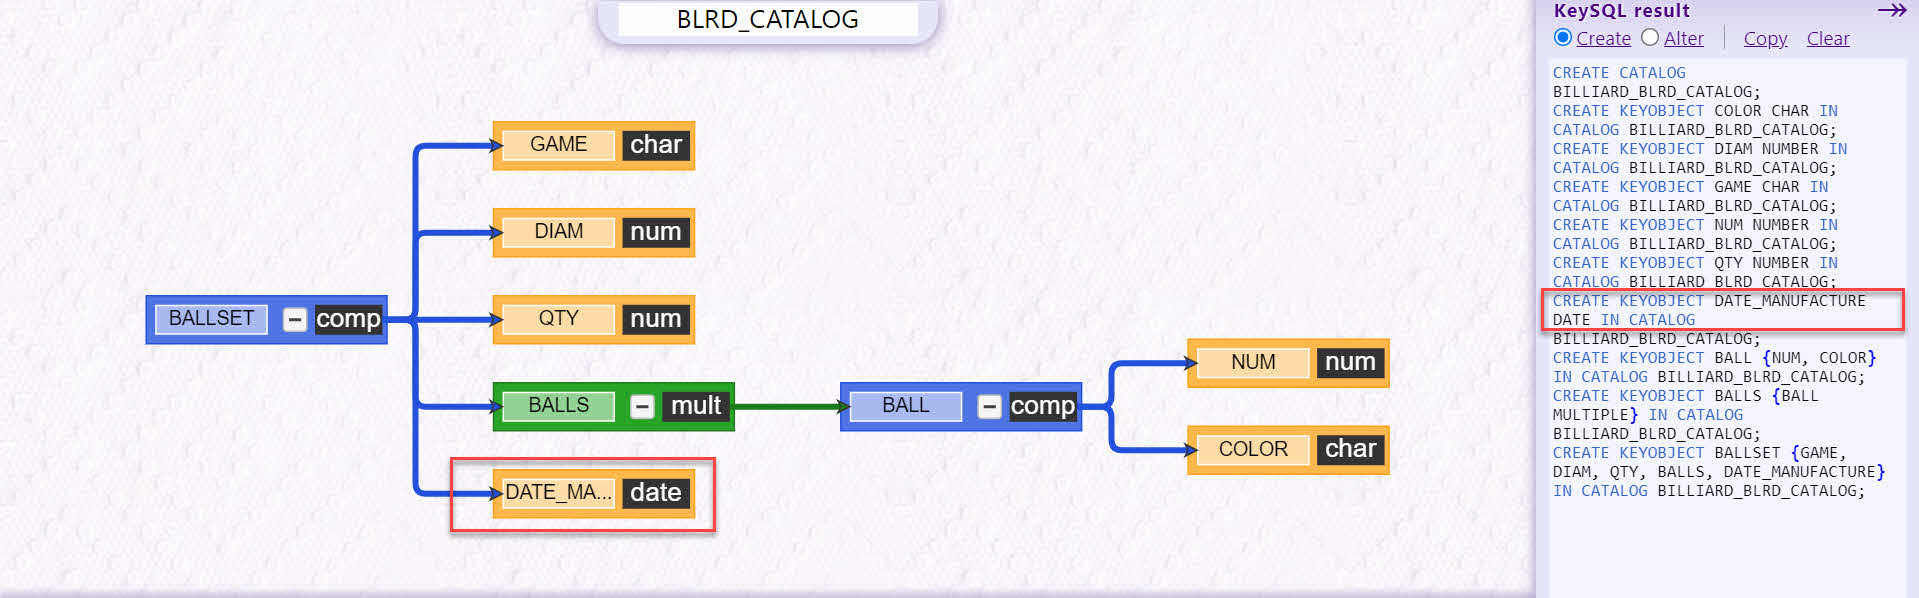
The screenshot below shows the KeySQL result tab, with the default Create radio button selected. This presents the KeySQL statements that represent the data model in its current state. The areas denoted by a red box (drawn on the screenshot) reflect the k-object DATE_MANUFACTURE, which is a k-object addition to the original data model. Compare this tab against the Diagram source tab in the prior screenshot:
Now you are shown the KeySQL result tab with the Alter radio button selected instead of Create:
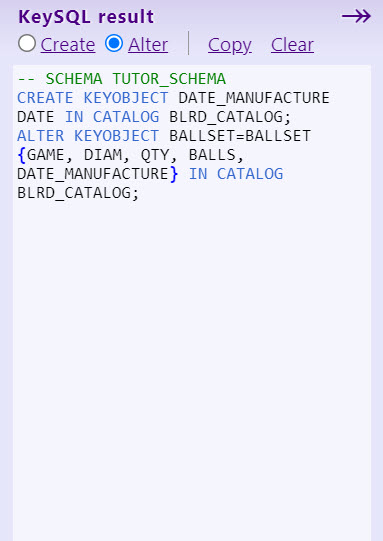
As you can see above, there are two KeySQL statements required to alter the original catalog so that it includes the new DATE_MANUFACTURE k-object.
This section presents more advanced techniques for building your data model, which can also be time-savers.
Familiar cut-and-paste is available via keyboard short cuts. Note that as in the case of many graphic applications, the pasted object may be placed directly on top of the original object. When you drag the topmost k-object, you will see the original, underlying one.
When you click on an elementary k-object in the data model, you select just that object. And the behavior is how you' d expect, in terms of deletion and dragging that k-object.
In contrast when you select a composite k-object, the behavior is more complicated:
The screenshot belows depict a copy-and-paste operation (for Windows this would be Ctrl-C followed by Ctrl-V) performed on BALL. The first step is selecting the BALL composite, and clicking the copy key combination:
The second step is clicking the paste key combination, and dragging the composite k-object family to a new location on the canvas. Note how the composite and constituent k-objects have the orchard color selection box, which indicates these can be dragged as a group:
Tip: By a double-click on a composite k-object, you can select and drag the composite k-object and its constituent k-objects as a group.
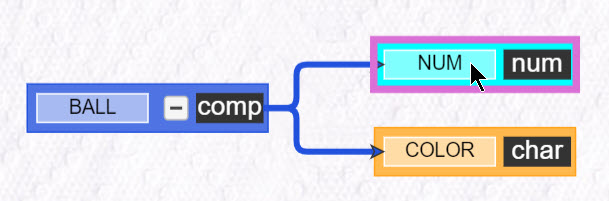
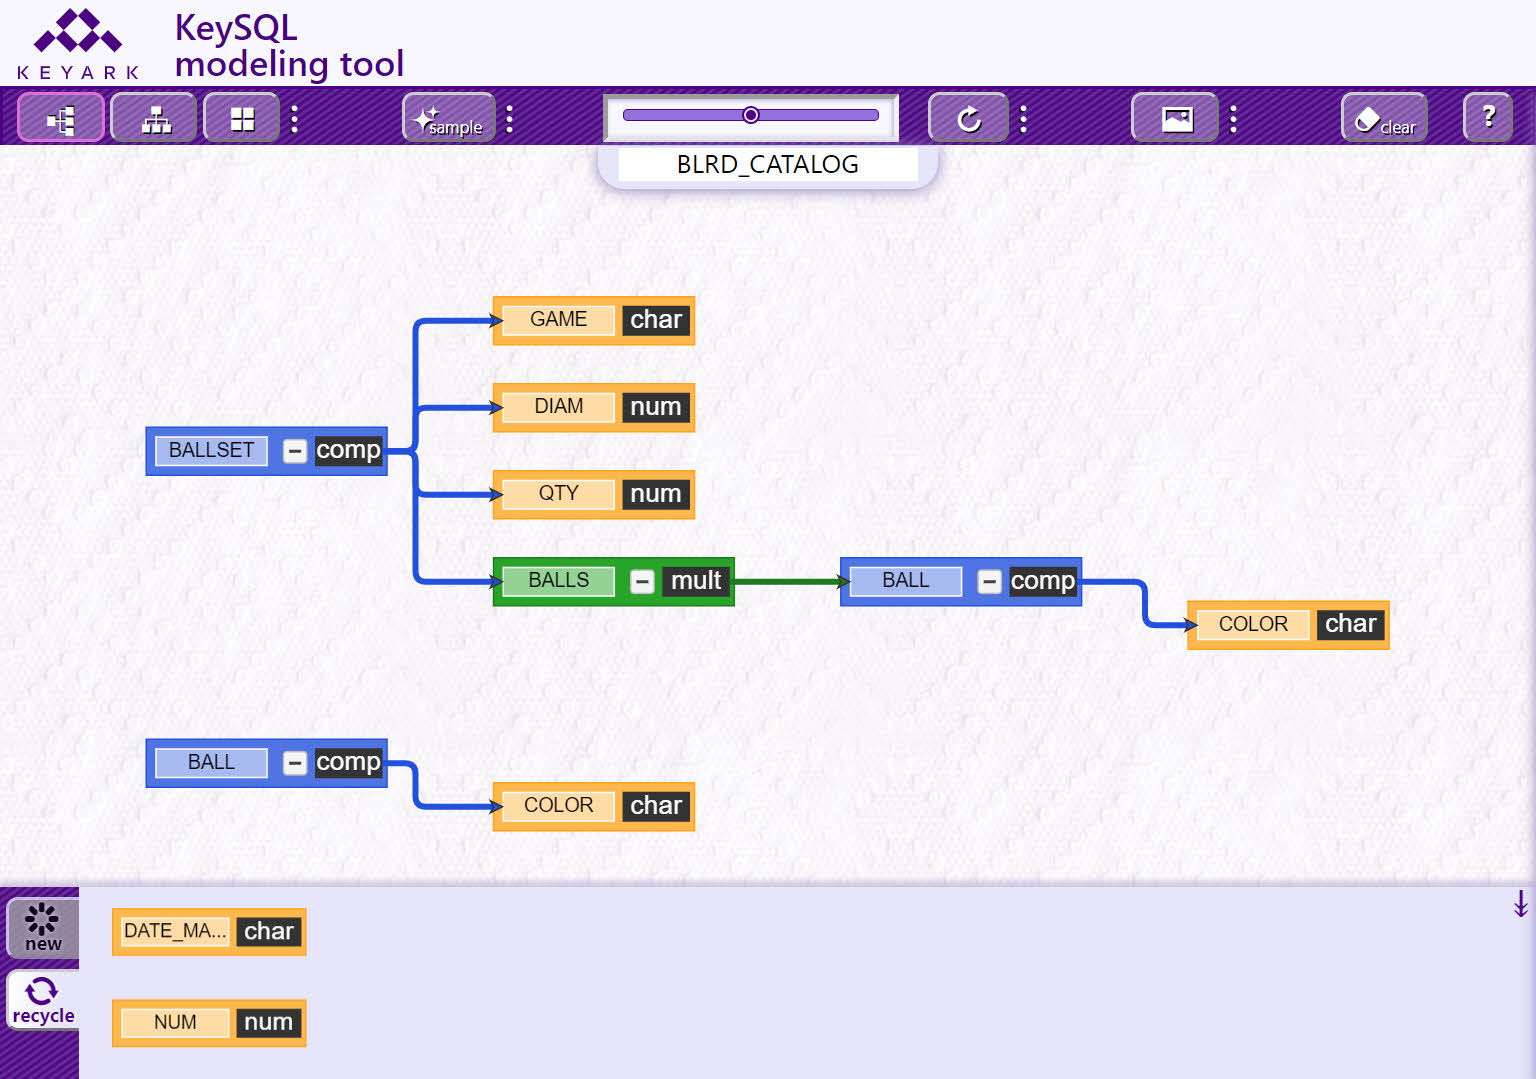
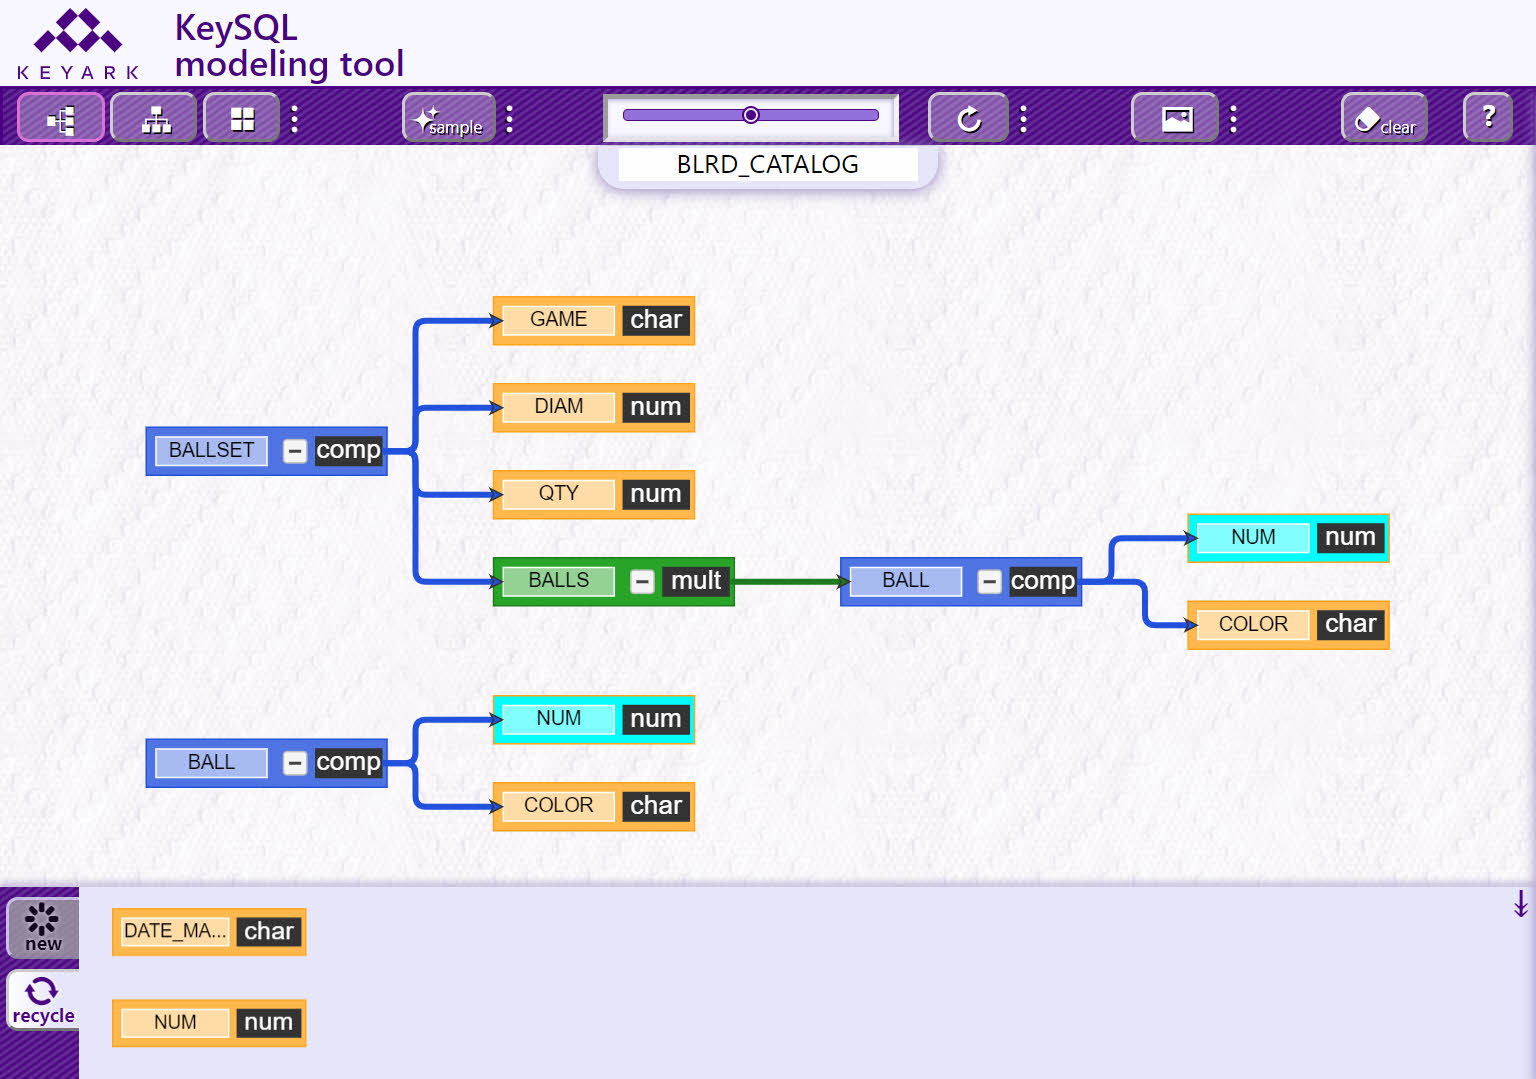
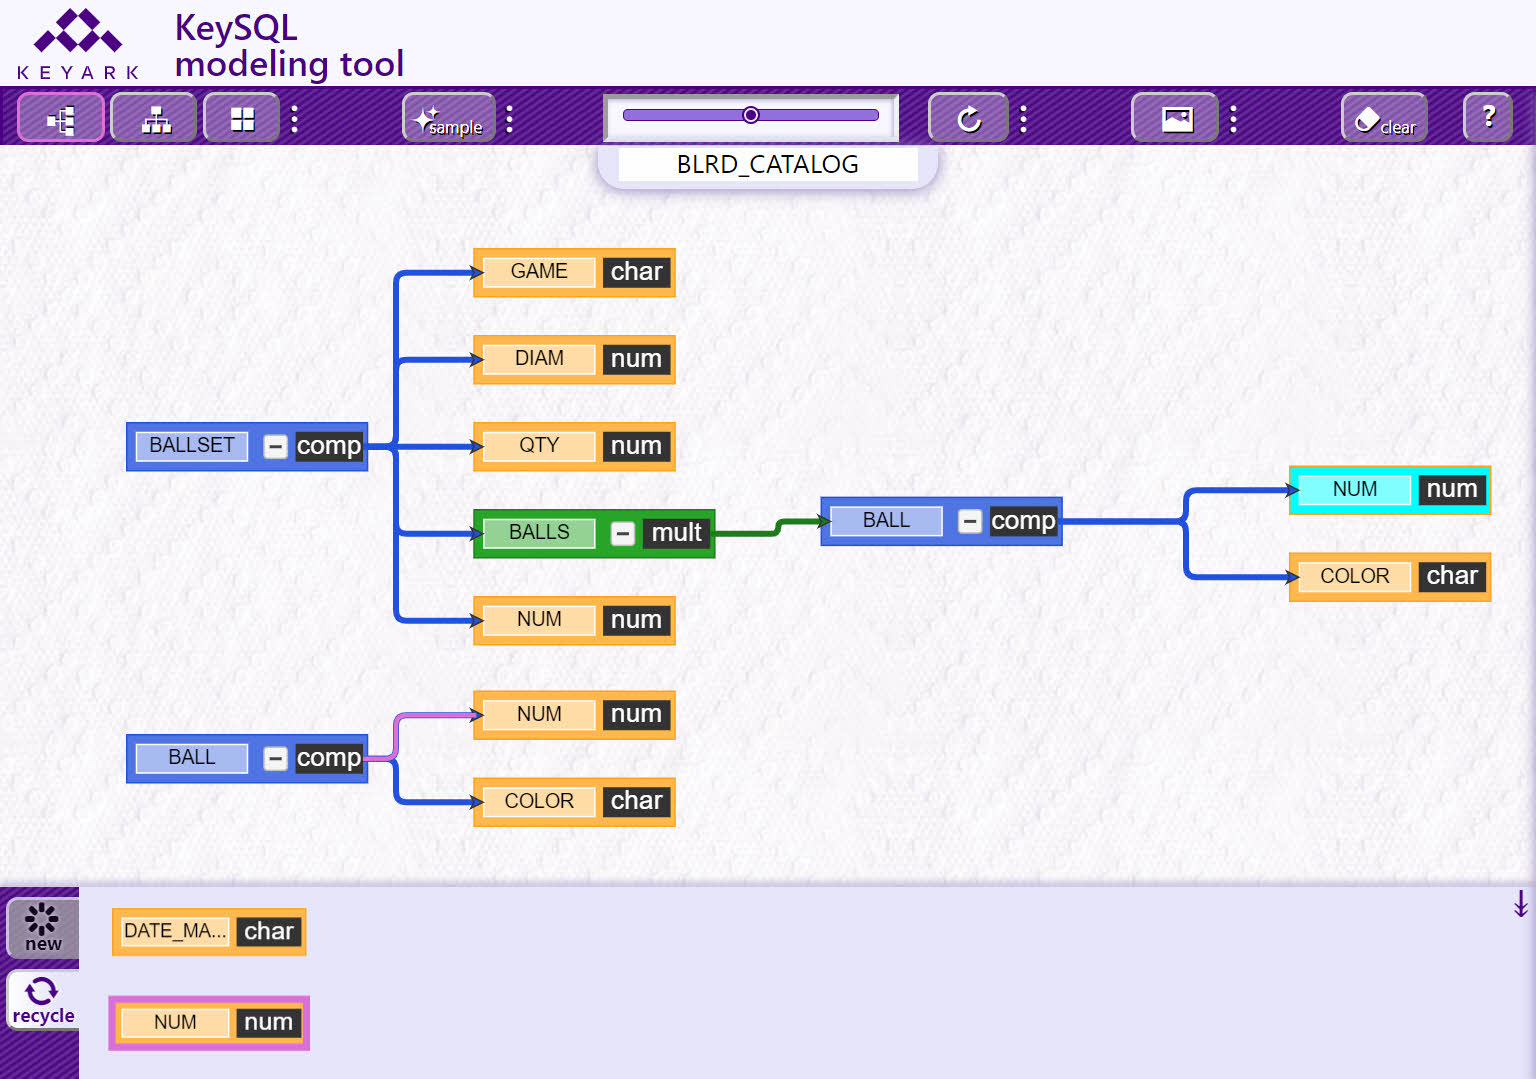
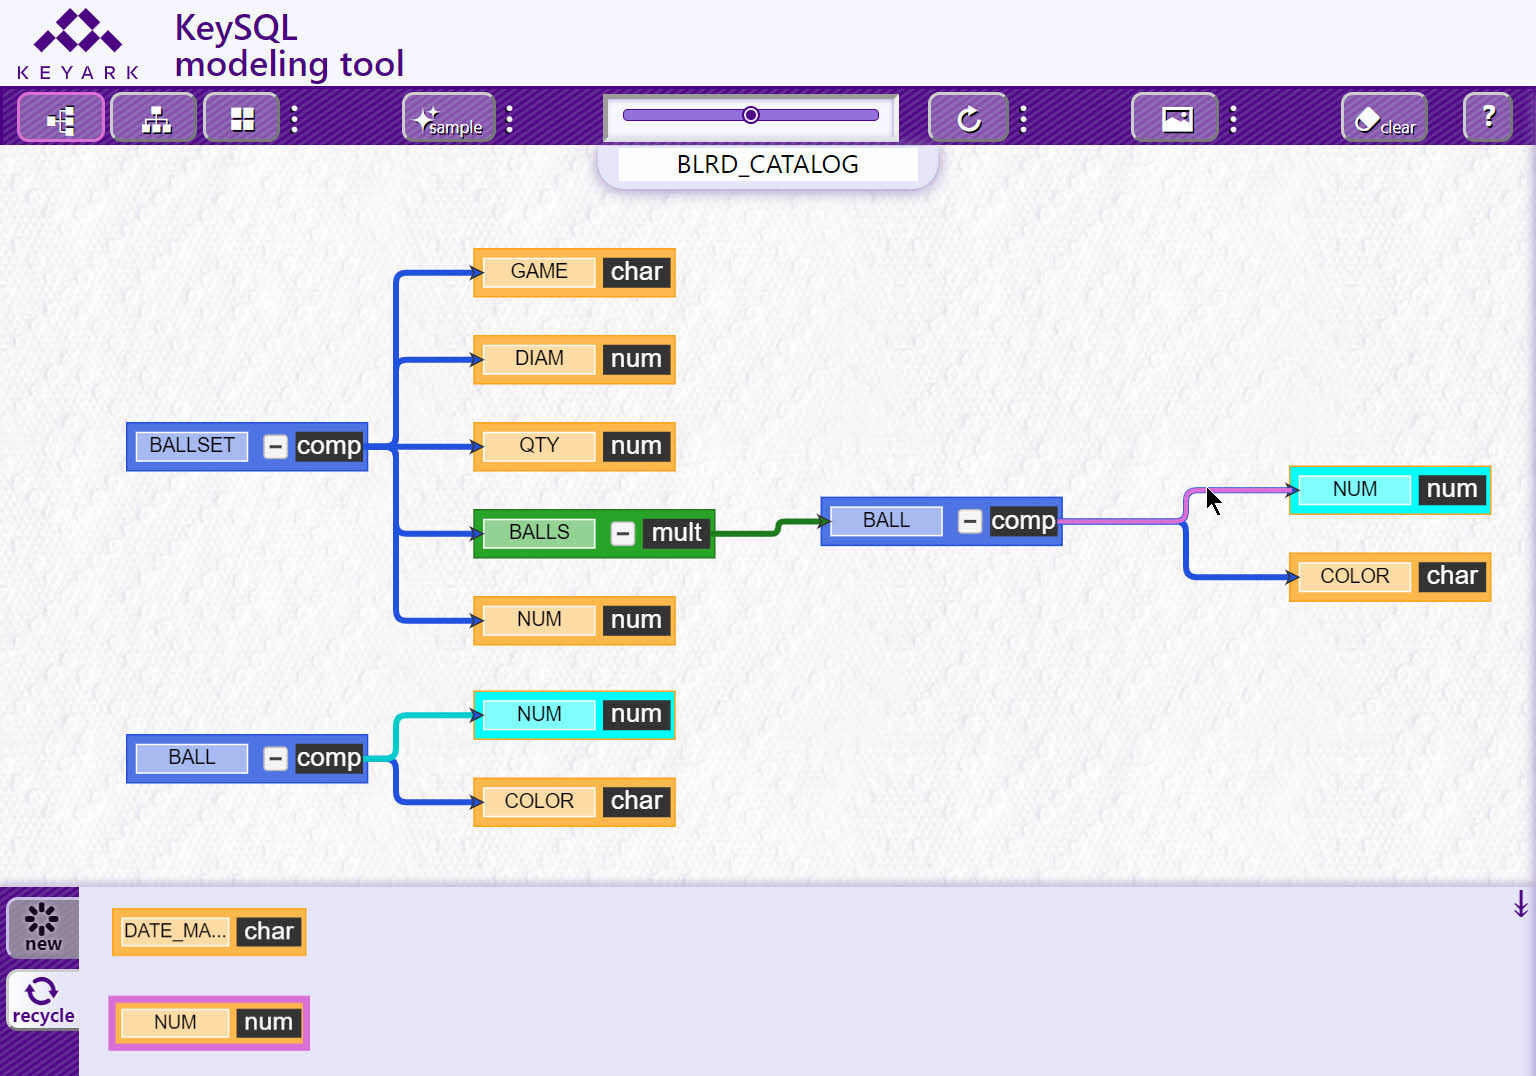
A real time saver is that the Data Modeling Tool automatically updates every occurrence of a cloned k-object, such as BALL, should you rename, add, or remove a child component of that clone. Note in the screenshot below how the elementary NUM k-object has been selected:
Upon clicking the Delete key, NUM is removed from all the clones. Note how NUM is automatically placed in the recycle tab, accompanied by the DATE_MANUFACTURE k-object which was removed earlier. Both are available for re-use:
With the Undo shortcut key, we restore the original composite which included NUM. Note how NUM continues to be available from the recycle tab:
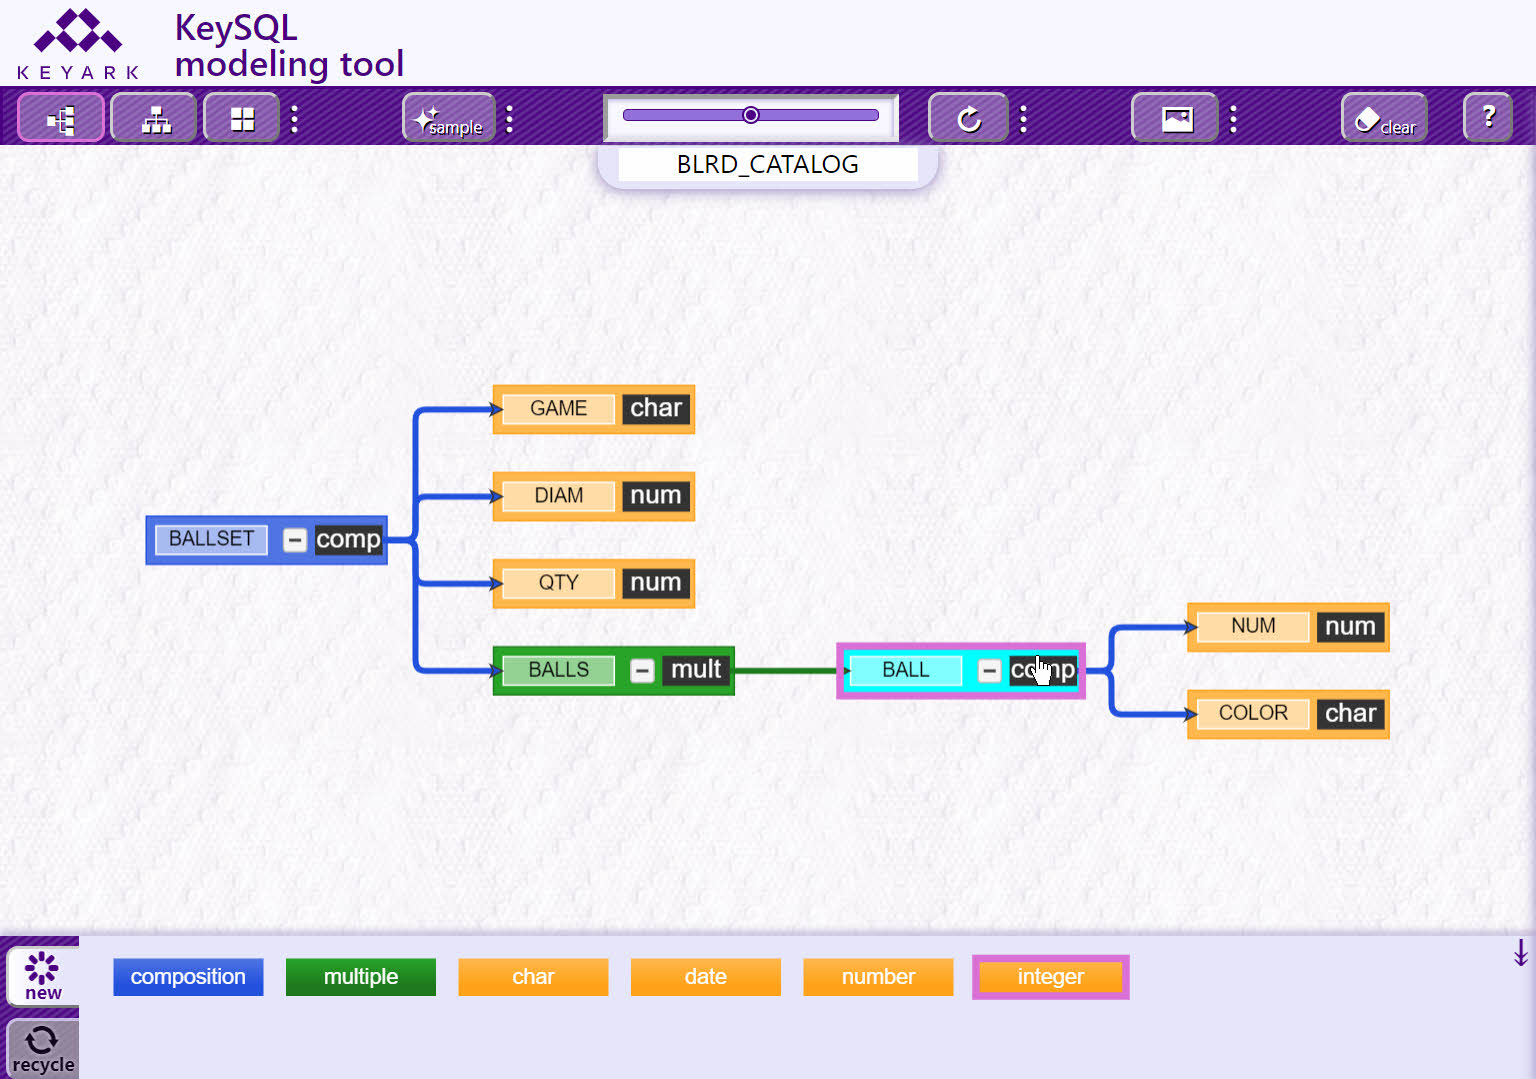
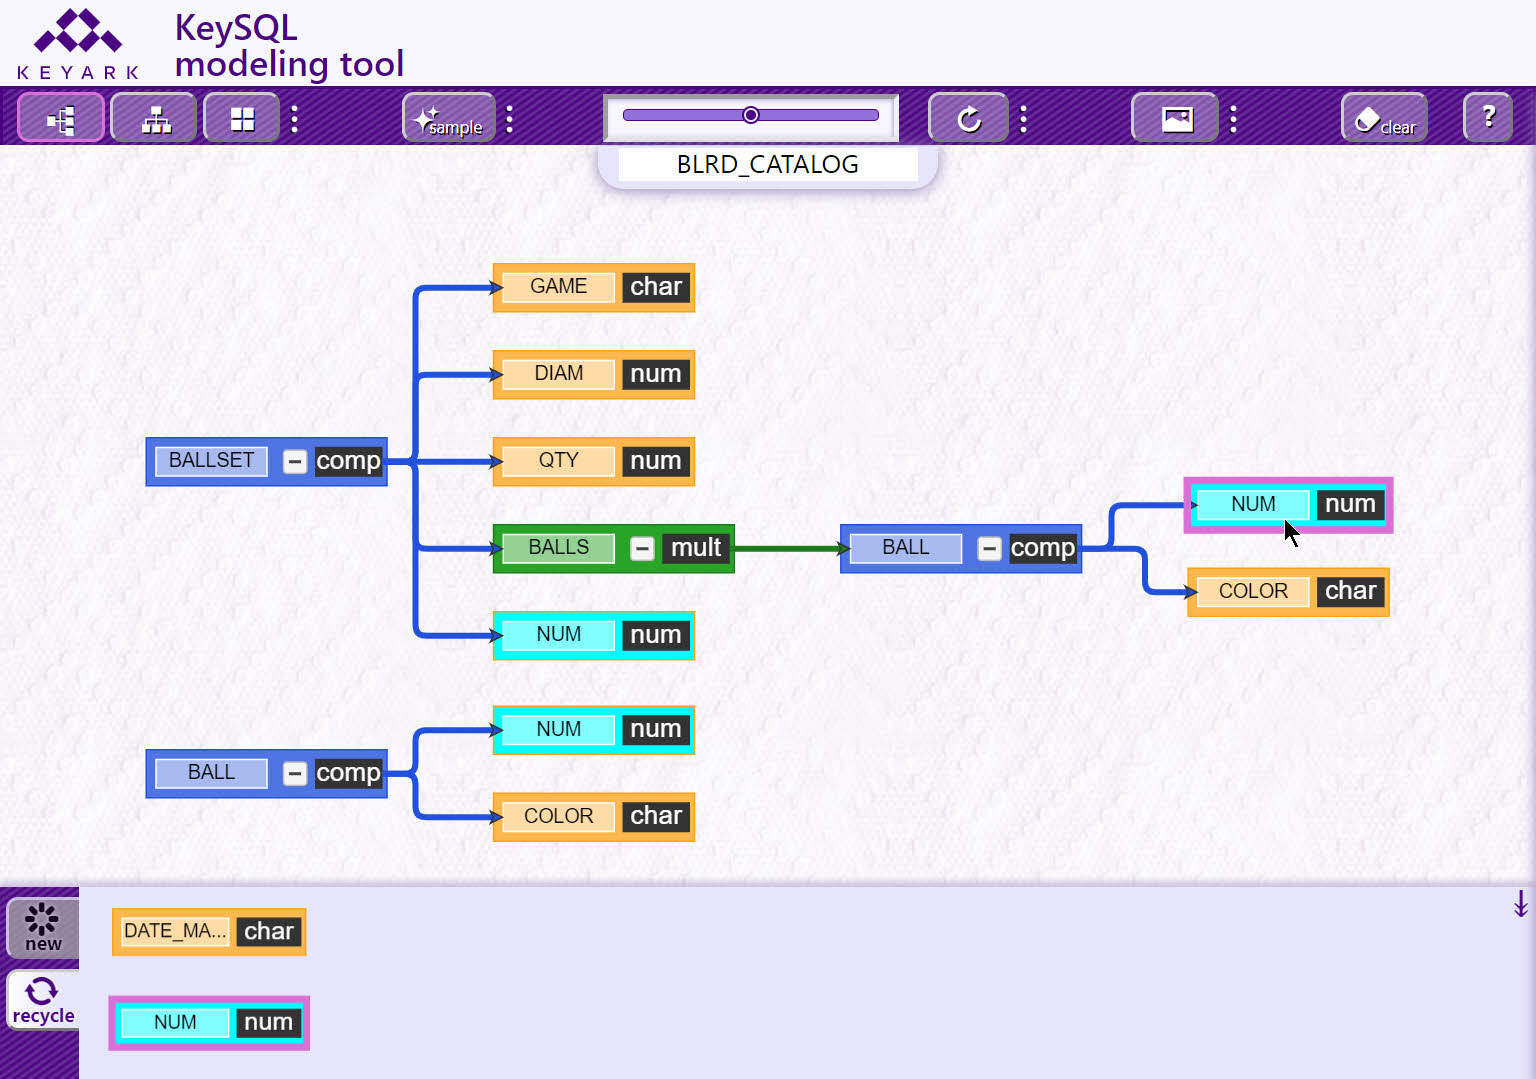
For the next demonstration, we attach NUM to the host k-object BALLSET. We then select the NUM found in either of the two BALL composites. As usual, when a k-object is selected it appears in aqua with an orchid box, and every occurrence of the same k-object throughout the data model also appears in aqua:
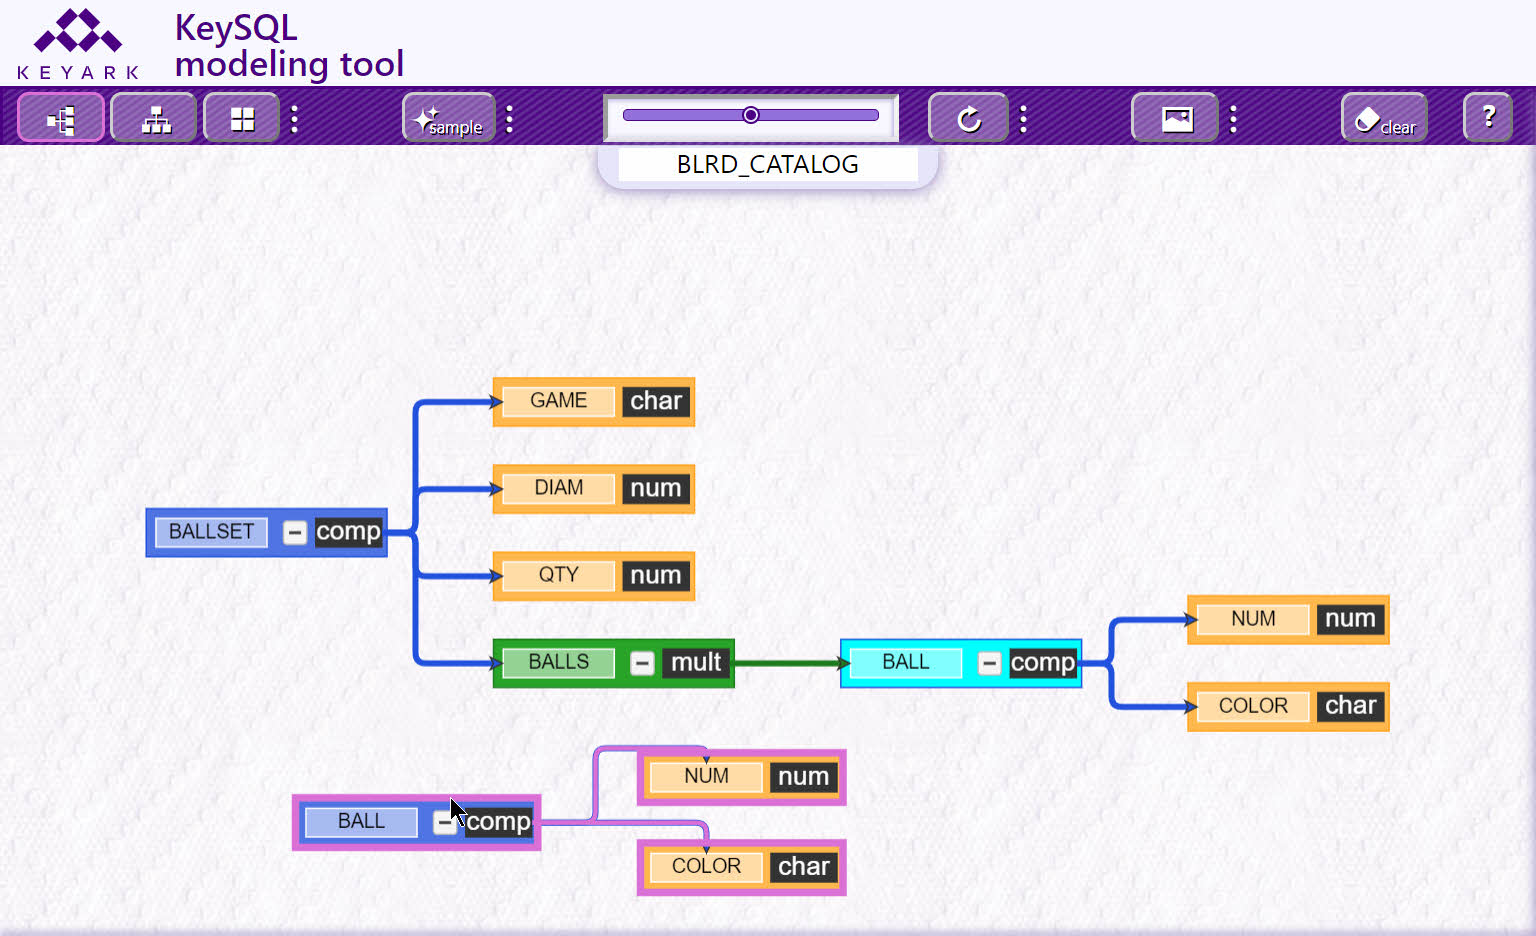
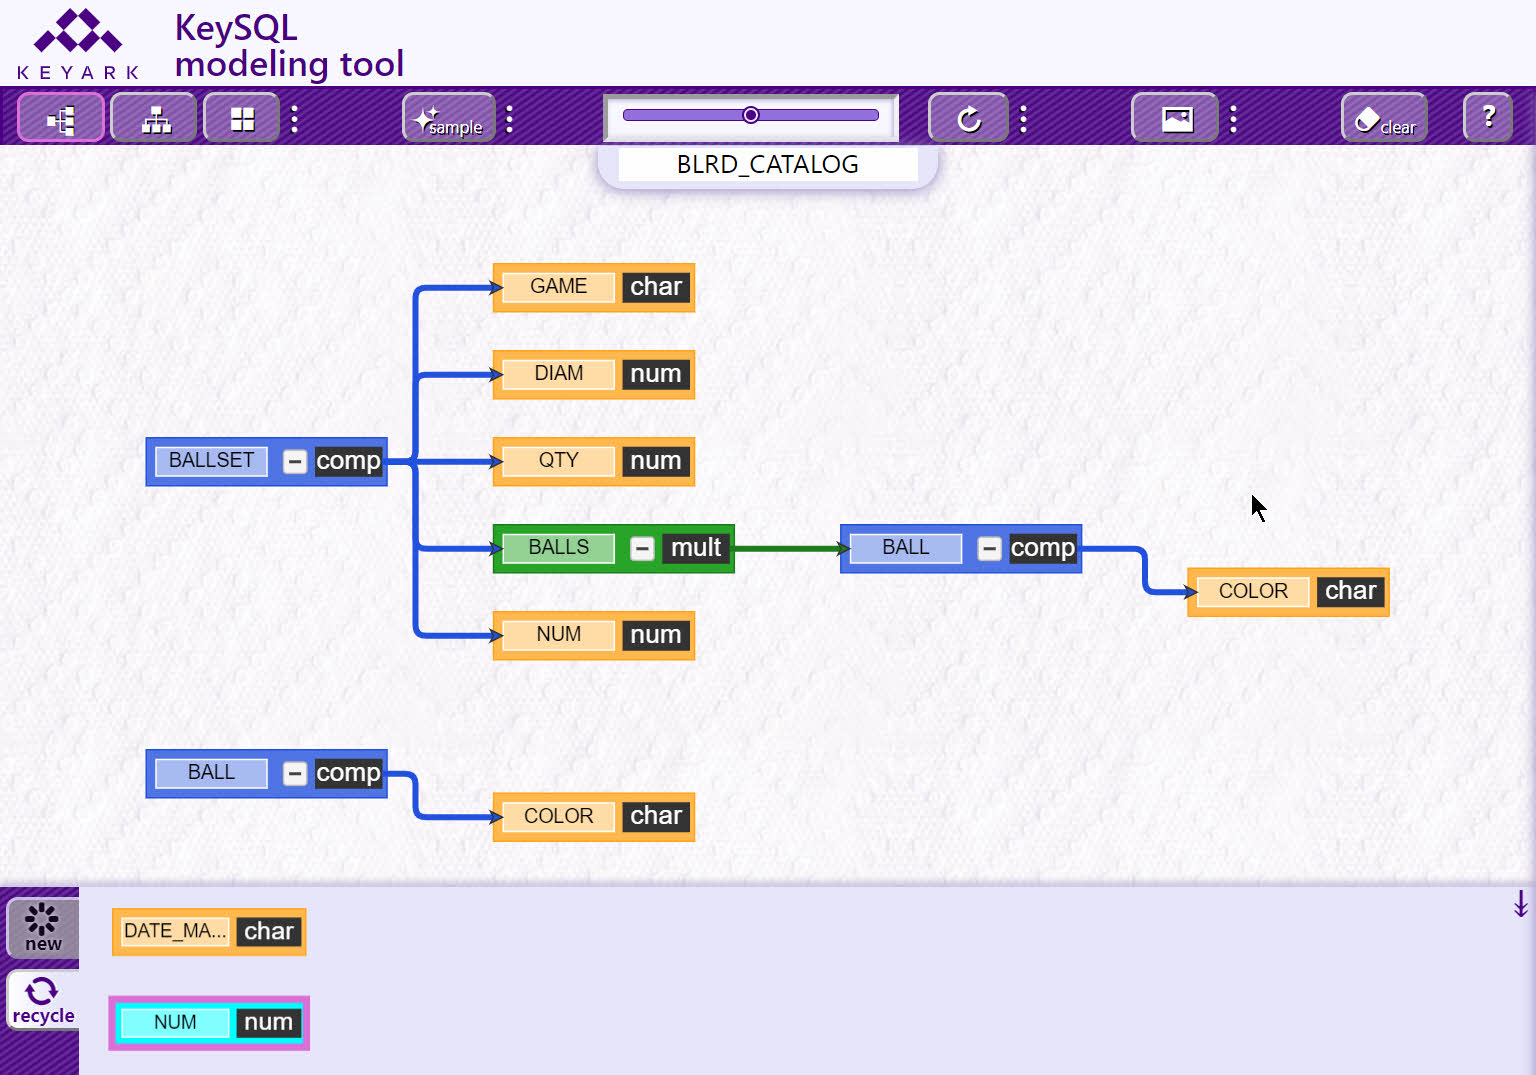
When the Delete key is clicked, NUM is removed from the two BALL clones. Note how NUM is still connected to BALLSET, as the BALLSET composite is not a clone of the BALL composite:
As a convenience the tool can show you in advance which k-objects will be impacted by a delete or addition. Let's add NUM back to the BALL composite. Drag and connect it to either BALL. Notice how both BALL clones now incorporate NUM, for a total of three occurrences of NUM:
Now click on the connector for the furthest right NUM, as shown below. The connector line displays as orchid, denoting its selection. Note how only two NUM, those found in the BALL clones, now appear in aqua color. This technique shows in advance which NUM will be affected should we add or delete:
Additional functionality is available when the KeySQL Data Modeling Tool is launched from KeySQL Studio. From Studio you can:
The tool's KeySQL result tab provides the KeySQL statements that define the data model. By copying these statements, and execution by KeySQL Studio, you preserve the data model as a catalog on KeySQL Server. Via the tool's Configuration form, you can re-import the catalog.
KeySQL Studio can output the design of a catalog as JSON statements, allowing your data model to be shared with other software tools and systems.